P-gp Substrates
Overview
P-glycoprotein (P-gp) is a clinically relevant efflux transporter that extrudes compounds from a large variety of cells. Its function has been associated with the drugs’ absorption, distribution, excretion, CNS effects, multidrug resistance (MDR). P-gp transports a variety of natural compounds and drugs of different therapeutic areas.
Rapid identification of drug candidates that are P-gp substrates and/or inhibitors is possible using P-gp specificity module. Filtering and exclusion of P-gp substrates/inhibitors from huge ‘in-house’ libraries of synthesized compounds or virtual libraries is possible, followed by exclusion of such compounds from further development. P-gp specificity module may serve as an initial screen that could replace screening test based on P-gp ATPase activity measurements and partially replace expensive experiments with P-gp expressing cell monolayers and P-gp knock-out animals.
Training of P-gp specificity models with ‘in-house’ data allows producing reliable predictions of P-gp interaction with compounds synthesized in your company.
Features
- The P-gp Substrates module uses probabilistic GALAS models to estimate whether the compound is a P-gp substrate and if so, whether it is a high-affinity substrate
- Both statistical models calculate Reliability Index (RI values) of predictions that indicates whether the test compound belongs to the Applicability Domain of the model.
- The general substrate specificity model supports training with 'in-house' data to increase Applicability Domain coverage
- The P-gp Efflux Ratio module provides a quantitative insight on P-gp efflux potential based on key physicochemical properties (lipophilicity, ionization, molecular size, etc.)
- Quantitative Efflux Ratio (ER) values are supplemented with estimated contributions of transport by passive and active routes
- A heatmap allows exploring the influence of changing major physicochemical properties on the compound's efflux potential
- Both submodules displays experimental values for the 5 most similar compounds with referenced data from P-gp DB
- Training set consisted of almost 3,500 compounds with reference data compiled from about 1,500 original publications.
IMPORTANT NOTE:
If you installed Percepta as an in-place upgrade with Expert user privileges, the program will attempt to preserve any custom configuration of Self-training libraries that was configured in your previous installation. This configuration will not include the new, significantly extended built-in library that was introduced in 2024 release. In this case, to take advantage of the new library, you may need to click "Configure" in P-gp Substrates submodule and manually select the following entry: P-gpS v. 1.3 (read-only).
In case of a new installation, the new library should be selected automatically with no further action required.
Interface
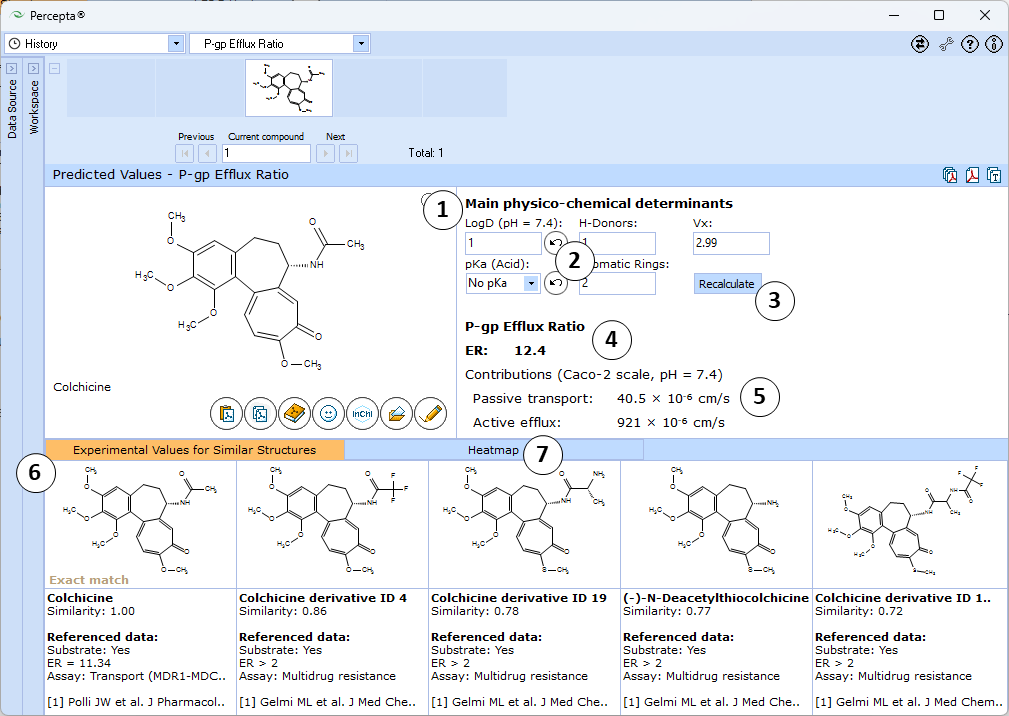
P-gp Efflux Ratio

- Main physicochemical descriptors (LogD7.4, No. of H-Donors, McGowan volume, Acid pKa, and No. of Aromatic Rings) that are used as inputs for calculation. By default, automatically calculated values are used. Enter experimental values to improve prediction accuracy or type custom values to model the influence of the respective properties on P-gp efflux potential of the compound of interest.
- Click the "Undo" button to revert the manually entered property value to the automatically calculated value (LogD and pKa (Acid) in this picture) for a compound and to recalculate Efflux Ratio
- Click to recalculate Efflux Ratio using the currently specified parameter values
- Estimated P-gp Efflux Ratio (ER) - the ratio of basolateral-to-apical and apical-to-basolateral transport rates in polarized transport assays
- Estimated contributions of passive and active transport routes to the overall ER value modeled at conditions corresponding to Caco-2 cell line at pH = 7.4 and 100 rpm stirring
- 5 most similar structures from the training set with compound names, experimental results (exact ER values or intervals), type of assay used for measurements, and references
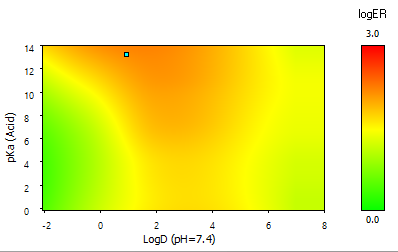
- A "heatmap" plot illustrating the partial dependence of P-gp efflux potential on lipophilicity and ionization parameters. The cyan-colored dot indicates the position of the current compound:
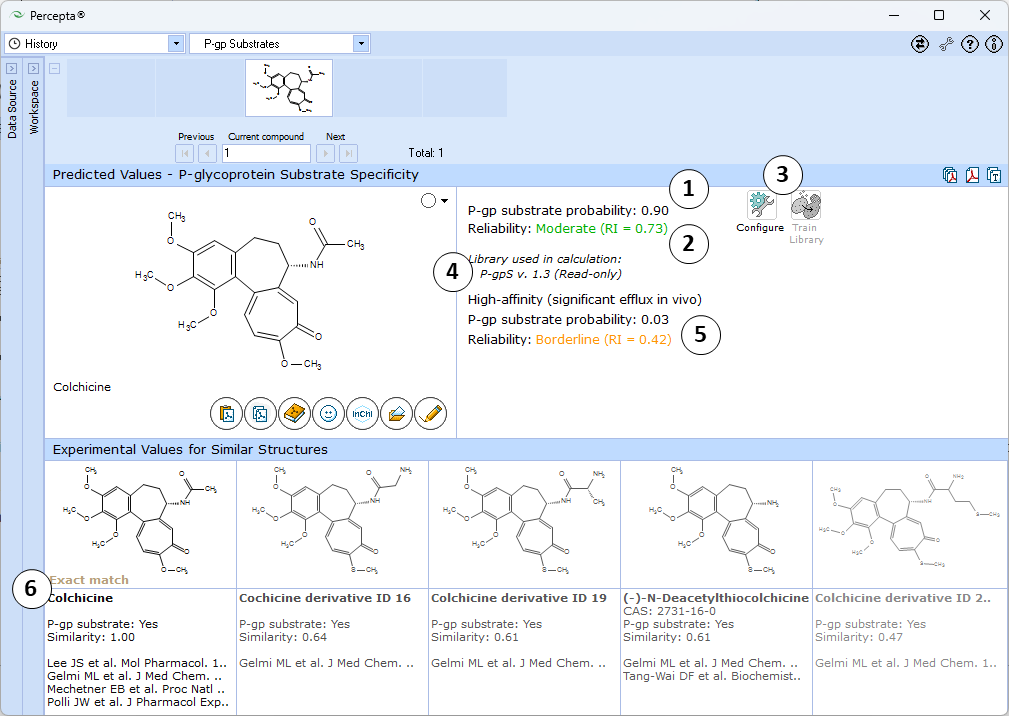
P-gp Substrates

- Probability of the compound being a P-gp substrate
- Indication of the prediction reliability (Reliability Index value)
- "Configure" and "Train" buttons provide the means to select the training library for use in calculations and to add new data to that library.
- The name of the currently selected library is indicated with italic font.
- Probability that the compound is a high P-gp substrate and exhibits significant efflux in vivo
- View 5 most similar structures with experimental values and references from P-gp DB
Note: Prediction reliability classification according to Reliability Index (RI) values:
- RI < 0.3 – Not Reliable,
- RI in range 0.3-0.5 – Borderline Reliability,
- RI in range 0.5-0.75 – Moderate Reliability,
- RI >= 0.75 – High Reliability
Technical information
Experimental data
There are many in vitro and in vivo tests used in P-gp specificity studies that often produce contradictive results. P-gp specificity model is based on the data collected from scientific literature. The following assays for substrates were considered:
- In vitro polarized transport across P-gp expressing cell monolayers
- In vivo BBB models with P-gp knock-out animals, P-gp mediated drug resistance.
The respective assays for inhibitors were as follows:
- Drug efflux inhibition across/out of P-gp expressing cells
- MDR reversion.
The original data set for P-gp substrates contained >1,000 compounds, for inhibitors >1,500 compounds. In v. 2024, the P-gp substrate specificity training set has been expanded to almost 3,500 compounds with exact or censored ER data. About 2,900 of these can be unequivocally classified as P-gp substrates or non-substrates at a threshold of ER = 2, and the respective compounds were used to construct the updated Self-training library of the 'general substrate specificity' GALAS model.
Reference database
Percepta includes a browsable P-gp DB comprised of 2,290 compounds with experimental data related to their interactions with P-gp. Each compound in the DB is classified as a P-gp substrate or non-substrate (inconclusive or contradictive data are marked as Yes/No or No/Yes in the 'Substrate field) and efficiency of P-gp mediated transport is provided for substrates. High efficiency describes compounds that are transported with the rate similar to the best substrates (vinblastine, daunorubicin, paclitaxel). Similarly, drugs comprising the database are classified according to their Inhibitor liability. Potency field denotes effectivity of P-gp inhibition, High potency representing compounds that inhibit P-gp as good as standard inhibitor verapamil or even better.
In the Assays section, the methods that were used in the analysis of P-gp substrate/inhibitor specificity are listed:
- Substrate (in vitro transport assay) – polarized transport of drugs across P-gp expressing cell monolayers or decreased drug accumulation in MDR cells
- Substrate (in vivo BBB models) – increased distribution of drugs to the brain in P-gp deficient (mdr1a/b(-/-)) mice
- P-gp mediated resistance – P-gp overexpressing (MDR) cells demonstrate resistance to the drug
- Drug efflux inhibition – inhibition of drug efflux in P-gp expressing cells.
- MDR reversion – sensitization of P-gp expressing cells to “MDR profile” drugs (taxanes, anthracyclines, vinca alkaloids)
- P-gp ATPase modulation – activation or inhibition of P-gp ATPase. This assay does not differentiate P-gp substrates and inhibitors.
Model features & prediction accuracy
The predictive models of P-gp substrate specificity were derived using GALAS (Global, Adjusted Locally According to Similarity) modeling methodology (please refer to [1] for more details).
Each GALAS model consists of two parts:
- Global baseline statistical model employing binomial PLS with multiple bootstrapping using a predefined set of fragmental descriptors, that reflects general trends in P-gp substrate specificity.
- Similarity-based routine that performs local correction of baseline predictions taking into account the differences between baseline and experimental values for the most similar training set compounds.
GALAS methodology also provides the basis for estimating reliability of predictions by the means of calculated Reliability Index (RI) value that takes into account:
- Similarity of tested compound to the training set molecules (prediction is unreliable if no similar compounds have been found).
- Consistence of experimental values and baseline model prediction for the most similar compounds from the training set (discrepant data for similar molecules, i.e. alternating P-gp substrates and non-substrates lead to lower RI values).
Reliability Index ranges from 0 to 1 (0 corresponds to a completely unreliable, and 1 - a highly reliable prediction) and serves as an indication whether a submitted compound falls within the Model Applicability Domain. Compounds obtaining predictions RI < 0.3 are considered outside of the Applicability Domain of the model.
The presented method also forms the basis of model Trainability. 'Trainable model' methodology addresses the issue of the chemical space of ‘in-house’ libraries being considerably wider than that of publicly available data which results in limited applicability of most third-party QSARs for analysis of ‘in-house’ data. The ‘Training engine‘ makes appropriate corrections for systematic deviations produced by the baseline QSAR model based on analysis of similar compounds from the experimental data library. Expansion of this Self-training Library with user-defined experimental data for new compounds leads to instant improvement of prediction accuracy for the respective compound classes. Moreover, addition of 'in-house' data allows adapting the existing model to the particular experimental protocol used in your company and avoiding potential issues related to discrepancies between different experimental methods used for determination of drug interactions with P-gp.
If the compound is within model Applicability Domain (acceptable Reliability Index) accuracy and sensitivity of classification is close to 90% for both models.
