ACD/pKa GALAS Tutorial
Introduction
Since the explicit picture of ionization of a polyelectrolyte is very complex, the usage of pKa module needs additional comments. We suggest you a tutorial that guides you through the module and helps you to understand the ionization process better. Prior to following this tutorial, make sure that you are in Expert mode, and in the Expert Panel set GALAS versions of all available algorithms as defaults.
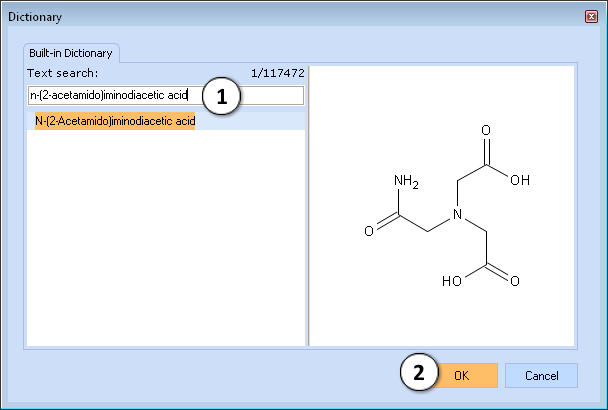
I. Find the compound n-(2-Acetamido)iminodiacetic acid in the dictionary by clicking the ![]() button (or the shortcut Ctrl + D) and typing its name in the text field:
button (or the shortcut Ctrl + D) and typing its name in the text field:
- Type the compound name
- Click to perform calculation
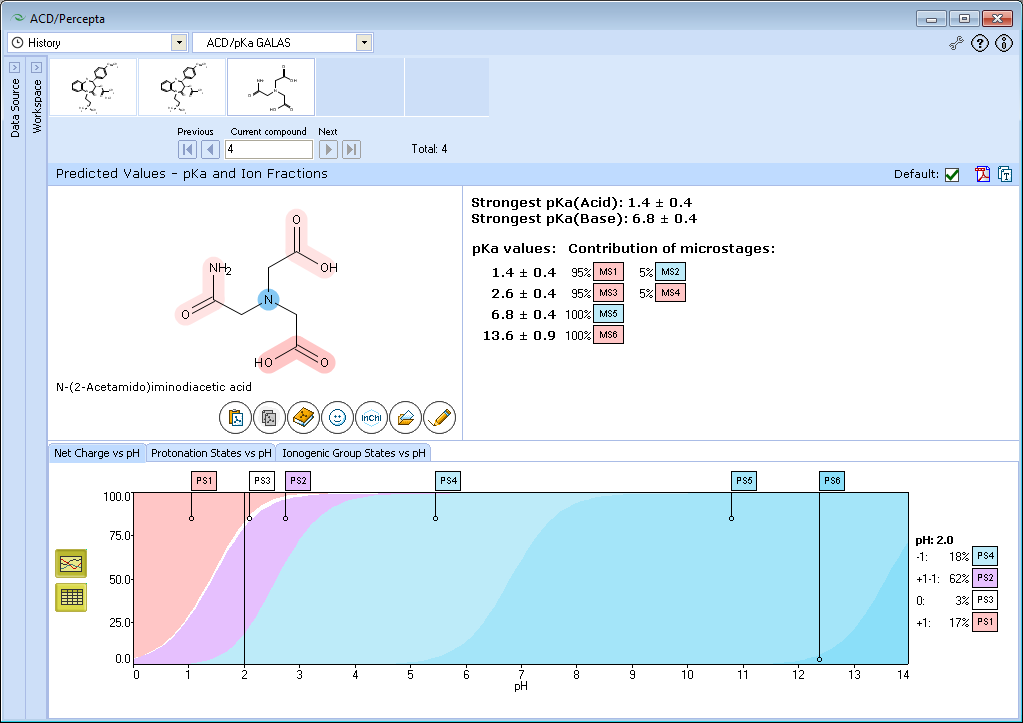
The result of calculation appears on the screen. Three ionogenic groups are marked in the molecule of ADA. Red shading means acid group, blue means base.
pKa constants of all ionization stages are listed on the right of the molecule frame. It isn’t always possible to assign a single dissociation reaction to each ionization stage. All principal reactions (“microstages”) running during the stage are listed after the constant.
Microscopic and Macroscopic pKa Constants
Microscopic pKa constant, or microconstant, is a value that describes dissociation of a certain ionogenic group of the molecule. Since the presence of other charges in the molecule strongly influences the dissociation, there are different microconstants of group for each protonation state.
When the molecule has two or more ionogenic groups with pKa microconstants of comparable magnitude, they dissociate simultaneously. The dissociation runs at different extent, unless the microconstants are equal.
When the difference of microconstants is big enough (> 2), practically there is only one group dissociating during this stage, and it is evident that the experimentally measured pKa value belongs to this group. In that case, the measured pKa (so called “macroscopic constant”) and the microconstant of the group coincide.
Let us assume that there are n ionogenic groups with equal pKa microconstants. In the first stage of ionization the molecule has n equivalent ways of losing a proton but only one site to which the proton can be restored (there is still only one atom ionized). The measured dissociation constant becomes n times higher than the micro constant of a single group. Consequently, pKa (measured) = pKa (microscopic) – log n. In the second stage of ionization the correction (or “statistical factor”) becomes log[(n – 1)/2], then log[(n – 2)/3], and so on.
In the intermediate case, when the pKa microconstants are not equal, the correction is less than the calculated statistical factor. The correction quickly comes down with increasing difference of microconstants.
Assignment of Ionizing Groups
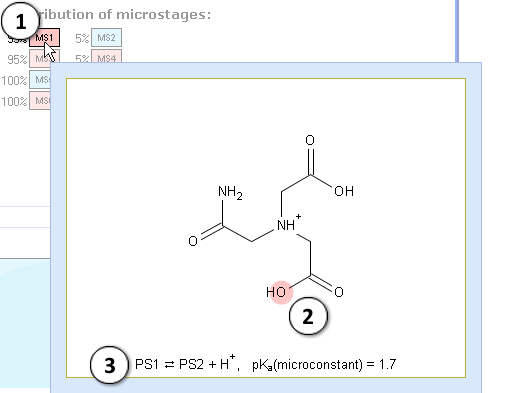
II. Let’s analyze the first stage of ionization (pKa = 1.4). Take a look at the microstage MS1. pKa miroconstant 1.7 describes the equilibrium between the protonation states PS1 and PS2. You may also view them by simultaneously moving the mouse pointer to their labels near the plot:
- Hover over the label to view the microstage MS1
- Red shading denotes the ionization center, i.e. the atom that loses the proton during this microstage (oxygen of a carboxylic acid)
- This microstage represents the equilibrium between the protonation states PS1 and PS2
III. Now look at the reaction in MS2. Microconstant 2.7 describes the proton lost at the nitrogen atom of amino group.
- Indicates the percentage of molecules which lose the proton at the nitrogen atom
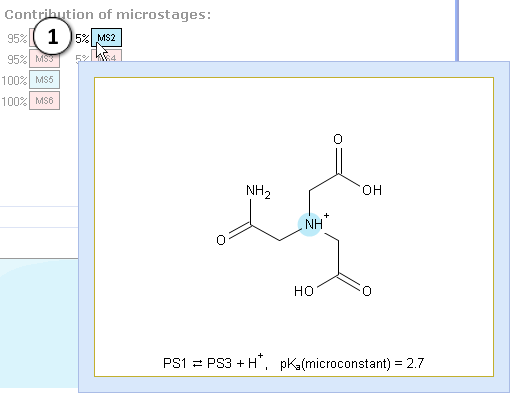
The percentage before the MS2 label shows that only 5% of molecules lose the proton at the nitrogen atom – the rest loses it at the oxygen. In other words, this stage of ionization consists of 5% dissociations of amine (base), and 95% of carboxylic acid. Hence we may assign the pKa value 1.4 to the carboxylic acid. The correctness of this assignment becomes more evident when we apply the statistical correction to the microconstants of two carboxylic acids: 1.7 – log 2 = 1.4 (carboxylic acid; contribution 95%). Microconstant of amine remains 2.7 (amine; contribution 5%) as there is only one nitrogen atom losing a proton.
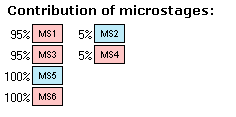
IV. Look at the whole list of stages. The two pKa values 1.4 and 2.6 we assign to the acids choosing ionogenic groups from the microstages with the highest percentage (leftmost records). Similarly, the value of 6.8 we assign to the base. The pKa value of strongest acid is the lowest value in the acid list (1.4) and the pKa value of strongest base is the highest value in the base list (6.8).
Now we can review the main path of ionization. Move the mouse pointer in sequence over the labels in the leftmost column MS1 – MS3 – MS5 and notice how the protonation state of the molecule is changing.
Rearrangements
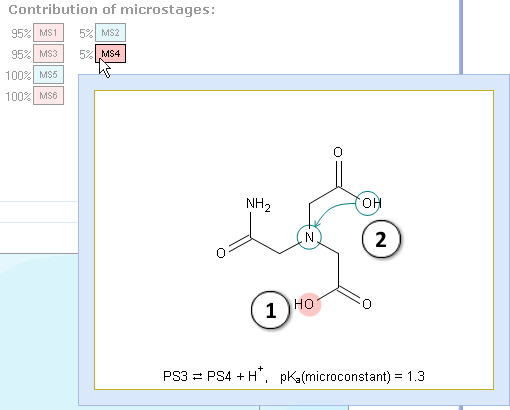
V. Let’s take a look at the microstage MS4 where the rearrangement occurs simultaneously with the dissociation: a proton changes its location in the molecule. It is a superposition of 3 simultaneous processes: two atoms are losing protons, and one is regaining:
- Dissociation center
- The rearrangement: a proton changes its location in the molecule
Note: The list of pKa values does not include very weak acid (pKa > 14) and base (pKa < 0) ionization stages.
Net Charge
VI. Move the mouse pointer along the plot area and notice the change of the calculation results.

- Set the slider at pH = 2.0 by clicking or dragging with the mouse.
- The “net charge” is the arithmetic sum of all charges in the molecule. The zero net charge is further divided into neutral and zwitterionic forms 0, +1–1, +2–2, etc.
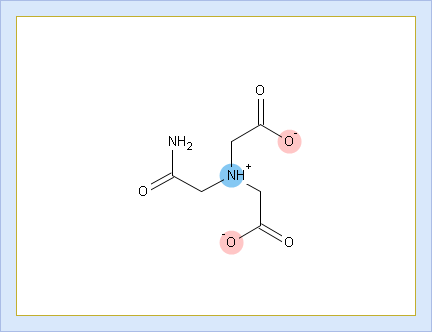
VII. Look at the protonation state PS4. The molecule contains 1 positive and 2 negative charges. Hence, the net charge of this form is +1 + (–2) = –1.
VIII. View the summary of the Net charge plot.
- Click the Table button to switch to tabular view. Net charge fractions are listed in the table at different pHs, including physiologically relevant ones.
- Copy the displayed results as the tab-delimited text to the clipboard, for pasting into any text document or spreadsheet, e. g. MS Excel.
- Click the Plot button to return to graphical view.

Protonation States
IX. Sometimes a single charge form can consist of more than one protonation state. Let us learn this on a more complex example. Find Edetic acid in the dictionary. The +2–2 charge form of this compound consists of two protonation states – PS3 and PS4.
- To analyze these states separately, go to the Protonation state plot by clicking the appropriate tab
- In the displayed complex plot click the Hide all button. All curves disappear.
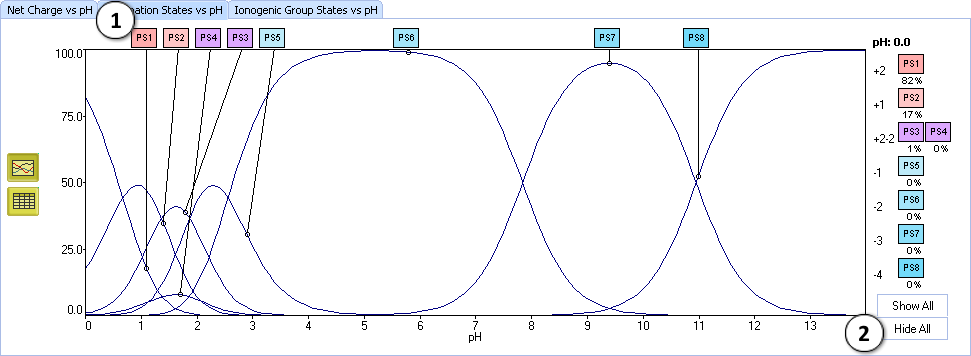
X. Let's analyze the considered protonation states:
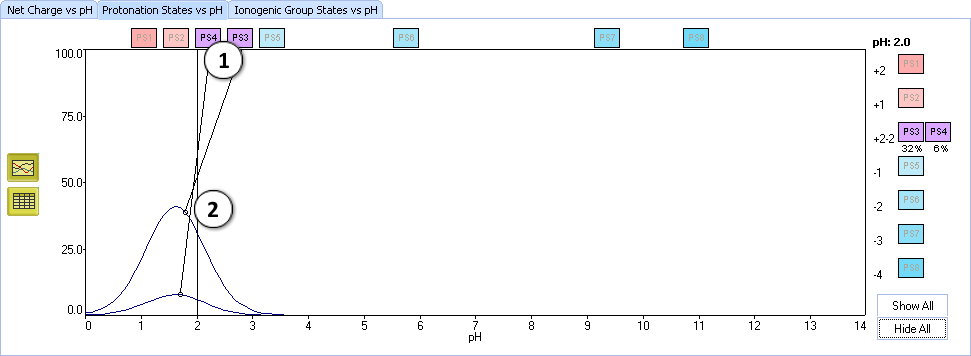
- Click the labels PS3 and PS4 to view only two curves
- Set the slider at pH = 2.0 and look at the percentage of protonation states. PS3 (32%, (a)) predominates over PS4 (6%, (b))
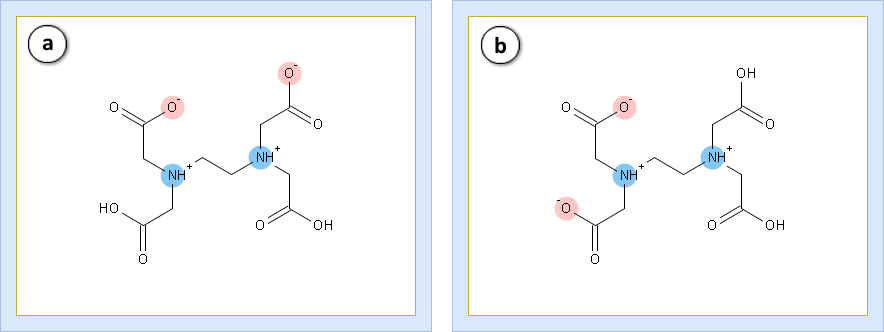
Click the Table button. You see the records corresponding to PS3 and PS4 only.

Ionogenic Group States
XI. The Ionogenic Group states plot is another viewpoint at the process of ionization. Each curve represents the average charge at a specified functional group in the mixture of all protonation states. Red line shows the total charge of all groups.

Let’s take a look at the functional groups. The edetic acid contains:
- a. Four equivalent carboxylic acid groups (G1 to G4)
- b. Two equivalent amines (G5 and G6)
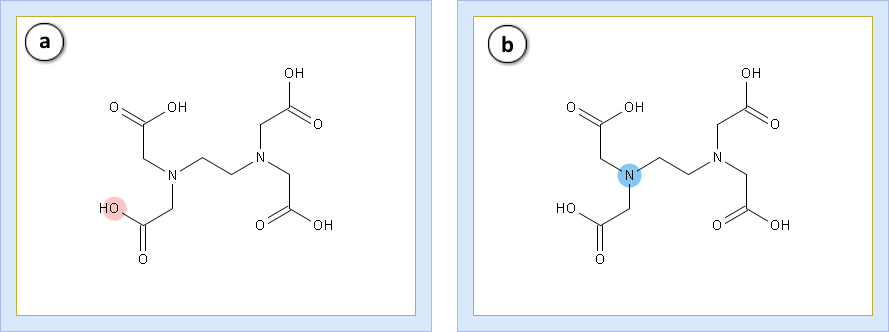
Matching lines prove the equality. Consequently, there are only two different kinds of groups in the molecule. The group state plot is useful for the ionization analysis of individual parts of molecule.
Permanent Charge
XII. Find thiamine in the dictionary. This compound contains both permanent charge and base ionization center.
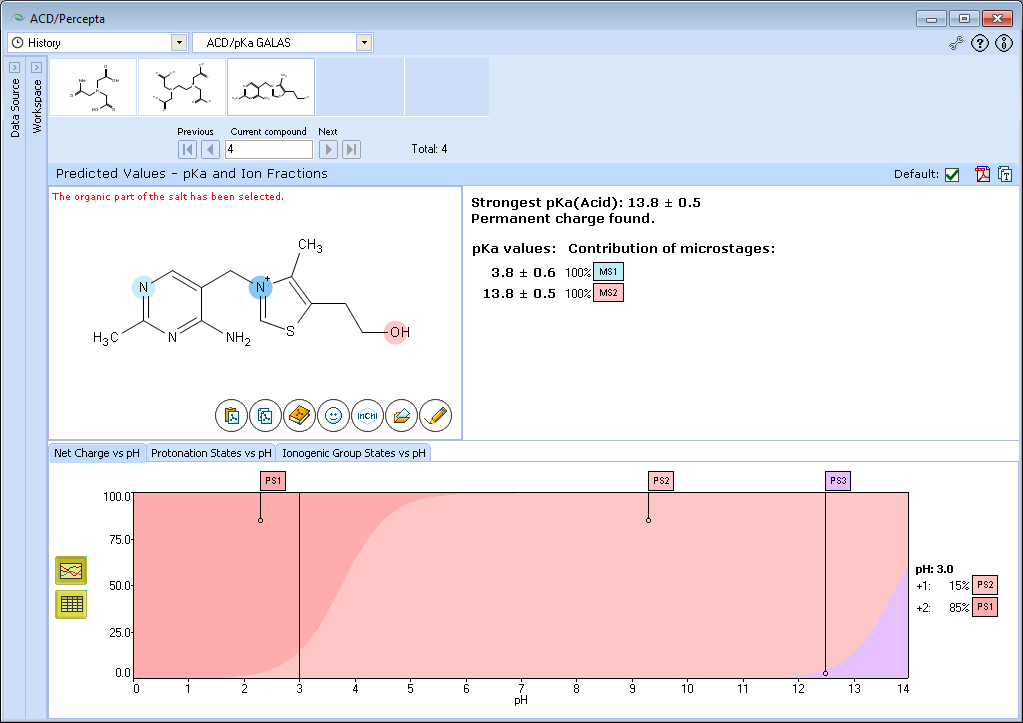
Since permanent charge behaves like a very strong base (is positively charged over the whole pH range), it is marked as the strongest base. Instead of record “Strongest pKa(Base)” you see the note “Permanent charge found”. Permanent charge doesn’t take part in any microstages. There is only one base pKa value in the list and it is assigned to a nitrogen atom in the pyrimidine ring.