LogP
Overview
This module calculates the value of the octanol-water partition coefficient – LogP. LogP predictions are exploited in many of our PhysChem and ADME prediction modules including LogD, Oral Bioavailability, Blood-Brain Barrier Permeation, and Passive Absorption, as well as in several Toxicity modules, such as hERG inhibition or Aquatic toxicity.
Features
- Includes two different predictive algorithms – ACD/LogP Classic and ACD/LogP GALAS. A Consensus logP based on these two models is also available.
- Provides a quantitative estimate of reliability of prediction by the means of 95% confidence intervals (ACD/LogP Classic), or Reliability Index (ACD/LogP GALAS).
- Offers color-coded representation of lipophilic and hydrophilic parts of the compound structure.
- Train the model with experimental values to improve predictions for proprietary chemical space
Interface
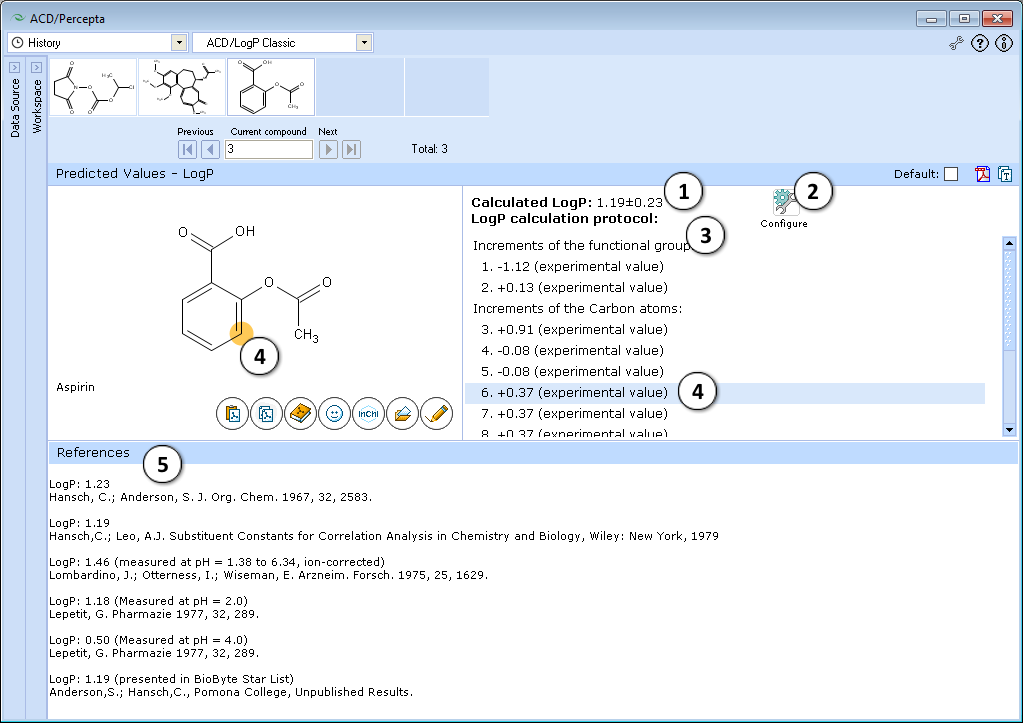
ACD/LogP Classic

- LogP prediction obtained using ACD/LogP Classic calculation algorithm.
- Press "Configure" button to switch model training on or off, and to select the database file to use for training.
- LogP calculation protocol. Lists the increments of all functional groups and carbon atoms, as well as the contirbutions of interaction through aliphatic, aromatic and vinylic systems.
- The protocol is interactive. Click on any entry to highlight the respective atom, group, or interaction onto the molecule.
- If the compound is found in LogP DB, all available experimental data for that compound are displayed along with literature references.
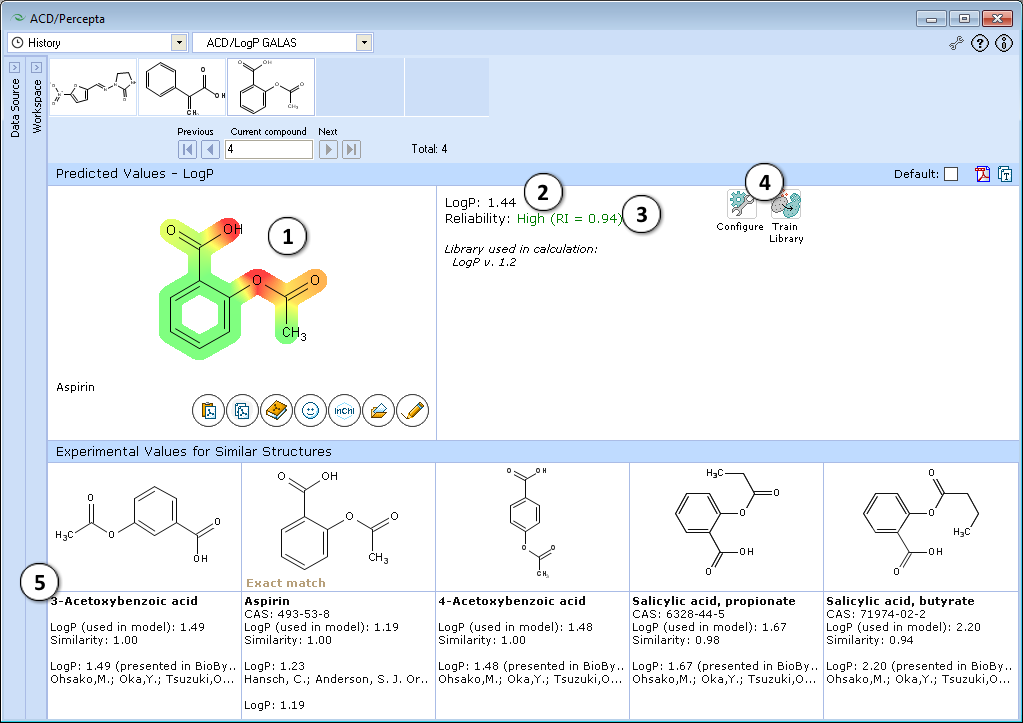
ACD/LogP GALAS

- Lipophilic parts of the molecule are highlighted in green, hydrophilic groups in red, and the intensity of the color indicates the predicted degree of lipophilicity or hydrophilicity of an atom or a substructure.
- LogP prediction obtained using ACD/LogP GALAS calculation algorithm.
- Reliability index (RI):
RI < 0.3 – Not Reliable,
RI in range 0.3-0.5 – Borderline Reliability,
RI in range 0.5-0.75 – Moderate Reliability,
RI >= 0.75 – High Reliability - "Configure" and "Train" buttons provide the means to select the training library for use in calculations and to add new data to that library. The name of the currently selected library is indicated with italic font.
- Displays 5 most similar compounds from LogP DB with experimental LogP values and literature references
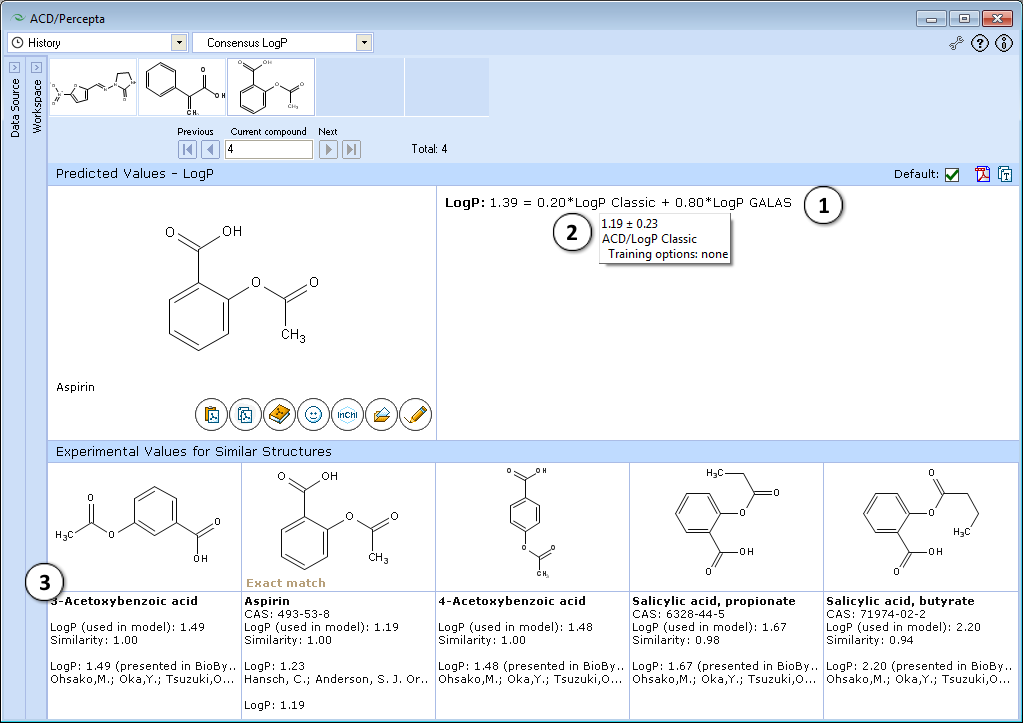
Consensus LogP

- The consensus LogP model predicts LogP as a weighted average of ACD/LogP Classic and ACD/LogP GALAS predictions. Each of the individual models is assigned with dynamic adaptive coefficients according to the indications of prediction quality. As a result, each model obtains larger weight in those regions of chemical space where it performs most reliably. The provided equation lists the weighting coefficients obtained for both models and the final Consensus LogP value.
- Shows 5 most similar compounds from LogP DB with experimental LogP values and literature references. The displayed similar structures are the same as in ACD/LogP GALAS module.
Technical information
LogP module provides the estimate of the value of the octanol-water partitioning coefficient for neutral species. Reliability of each prediction is quantitatively estimated via the calculation of the Reliability Index value. In addition a color-coded representation of the predicted property distribution is provided indicating lipophilic and hydrophilic parts of the compound structure.
Training set size: 11,387
Internal validation set size: 4,890
Main sources of experimental data:
- Reference books:
- The Merck Index. An Encyclopedia of Chemicals, Drugs, and Biologicals, O'Neil, M.J., Smith, A., Heckelman, P.E., Budavari, S., Eds. 13th Edition, Merck & Co., Inc., Whitehouse Station, NJ, 2001
- Therapeutic Drugs, Dolery, C., Ed. 2nd Edition, Churchill Livingstone, New York, NY, 1999
- Clarke's Isolation and Identification of Drugs, Moffat, A.C., Jackson, J.V., Moss, M.S., Widdop, B., Eds. 2nd Edition, The Pharmaceutical Press, London, 1986
- Various articles from peer-reviewed scientific journals*
- Other public data sources (online databases, handbooks, etc.)
* - Articles reporting LogP models by other authors were the predominant type among analyzed literature, meaning that each publication contained larger collections of experimental data (usually in the order of tens or hundreds compounds) compiled from corresponding original experimental articles.
Internal Validation
| Subset | Coverage of the entire internal validation set (N=4,890) |
R2 | RMSE | ||
|---|---|---|---|---|---|
| RI > 0.3 N = 4,872 |
|
0.94 | 0.46 | ||
| RI > 0.5 N = 4,772 |
|
0.95 | 0.44 | ||
| RI > 0.75 N = 3,345 |
|
0.96 | 0.36 |