Calculate Menu
Calculate Menu
- Properties - Calculate any from the variety of available PhysChem, ADME and Toxicity related properties. Opens the Properties Calculation List window.
- Categories - Differentiate compounds into several qualitative classes (Good, Average, Bad and Unknown) according to the most relevant PhysChem, ADME and Tox properties using the built-in profiling functions. Opens the Categories Calculation List window.
- Rank - Perform compound ranking, i.e., the prioritization with respect to the favorable/unfavorable profile of the selected PhysChem, ADME or Tox properties. Opens the Rank window.
- Expression - Opens the Expression Editor window. The Expression editor is used for calculating new columns using logical, mathematical, or text operations on the already existing columns.
NOTE: ACD/Percepta takes advantage of multiple computing threads, as a result, some of its basic functionality (e.g. the ability to browse the spreadsheet, or perform detailed single structure analysis in the Module View) is retained even at the time when any spreadsheet calculations are in progress. Regardless of the filters applied to the spreadsheet, commencing calculation procedure retrieves all compounds and predicts the corresponding values for all of them (so than no additional recalculation procedures would be necessary if filtering conditions are changed at a later time). The filter is re-applied again when the program completes all the calculations.
Properties Calculation
Calculate any from the variety of available PhysChem, ADME and Drug Safety related properties.
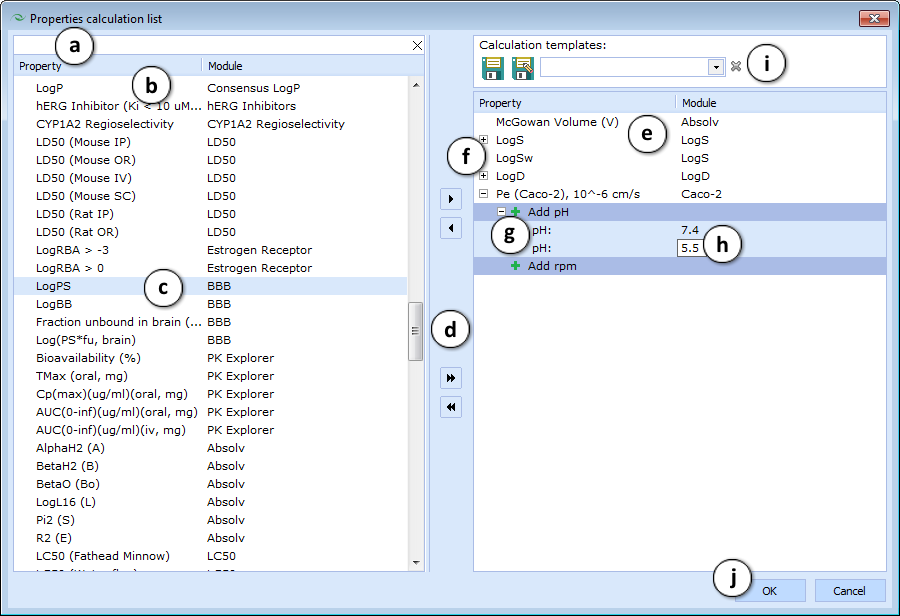
- Type the text in the text field to perform quick search.
- The list of properties available for calculation.
NOTE: The actual list depends on the particular license, i.e. the combination of single-structure calculation modules present under the Module View. - Click an individual algorithm to select it. Press Ctrl while clicking to select multiple fields.
- Use the arrow buttons to move selected fields between panes:
 move one or more selected fields and
  move all fields between panes.
 - The list of properties selected for calculation.
- Click “+” and “-” pictograms to expand/collapse the list of parameters required for calculation.
- Click the
 pictogram to add required parameters.
NOTE: You can add up to 5 specified parameters. - Enter the required value.
- Manage Calculation Templates - the user-defined lists of properties along with any required parameters, facilitating the calculation of the same property sets in multiple projects.
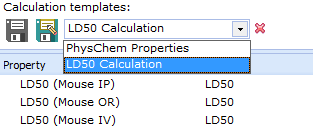
- All available templates are listed in the dropdown list. Select an entry to apply the respective template.
- Save button updates the active template or stores the selected property list as a new template if no template is currently active.
- Save as... button stores the selected property list under a new template name.
- Remove from list button deletes the active template.
- Click OK to proceed with the calculations. For each algorithm selected, a new column will be created, to which the calculated values will be written.
Categorization
Differentiate compounds into several qualitative classes (Good, Average, Bad and Unknown) according to the most relevant PhysChem, ADME and Drug Safety-related properties using the built-in profiling functions.
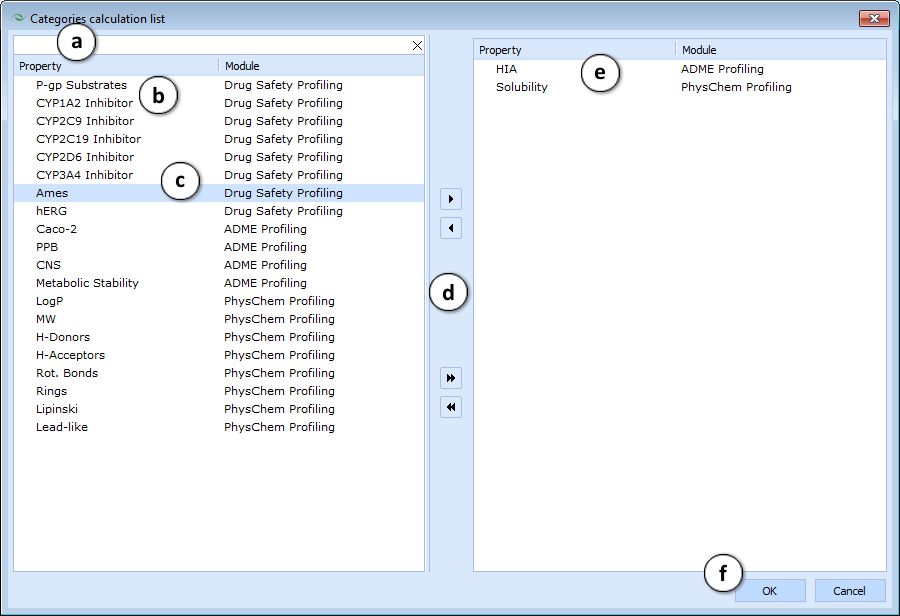
- Type the text in the text field to perform quick search.
- The list of the profiling functions.
- Click an individual profiling function to select it. Press Ctrl while clicking to select multiple fields.
- Use the arrow buttons to move selected fields between panes:
 move one or more selected fields and
  move all fields between panes.
 - The list of profiling functions selected for calculation.
- Click OK to proceed with the calculations. Each qualitative compound profile (Good, Average, Bad, Unknown) according to the corresponding property will be written to a separate new column of the spreadsheet.
Ranking
Perform compound ranking, i.e., the prioritization with respect to the favorable/unfavorable profile of the selected PhysChem, ADME or Tox properties.
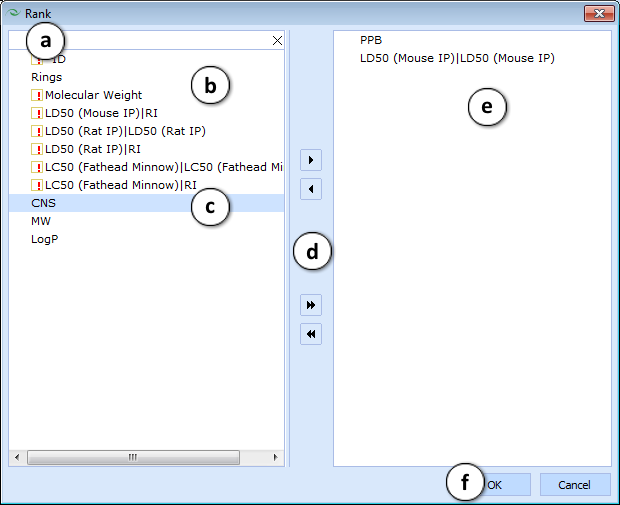
- Type the text in the text field to perform quick search.
- A list of all the columns available for use in compound ranking. Only fields containing qualitative category data (Good, Average, Bad, Undefined) can be used in rank calculation, therefore the list contains only the columns calculated using built-in categorization algorithms as well as columns containing any numerical (calculated within ACD/Percepta or imported) data that can be differentiated into aforementioned categories manually by the user. Red exclamation marks note the columns that have to be preprocessed prior to using them in ranking, i.e. the continuous data in them has to be split into intervals and each of those has to be assigned one of four available categories.
- Click an individual column to select it. Press Ctrl while clicking to select multiple fields.
- Use the arrow buttons to move selected fields between panes:
 move one or more selected fields and
  move all fields between panes.
 - The list of selected columns to be used in compound rank calculation.
- Press OK to proceed with the compound ranking that outputs the calculation results into a new spreadsheet column (please see below). In case any of the fields indicated with red exclamation marks have been selected, the wizard will appear guiding the user through the Interval Manager window for each of those, allowing the assignment of the qualitative categories necessary for rank calculation.
The newly calculated Rank column contains compound positions in the ranking list, i.e. the smaller this number is, the better is the analyzed profile for a particular molecule. Sort this column ascending to get your best compounds floating on top of the spreadsheet. Identical result in the Rank column indicates that a series of compounds received exactly the same score and consequently share the same position in the ranking. E.g. there are 20 compounds ranked as number “1”. This means that they all share the positions from the 1-st to the 20-th – the positions for subsequent compound(s) ranked lower will start from “21”. Therefore one should not expect that in a database of N compounds the Rank column will provide all the numbers from 1 to N. The higher the number of components (data columns) is used in the ranking the greater is the variability of the obtained ranking score and consequently the better is the separation between compounds and vice versa. Additionally it is possible to assign different importance factors to multiple ranking score elements.
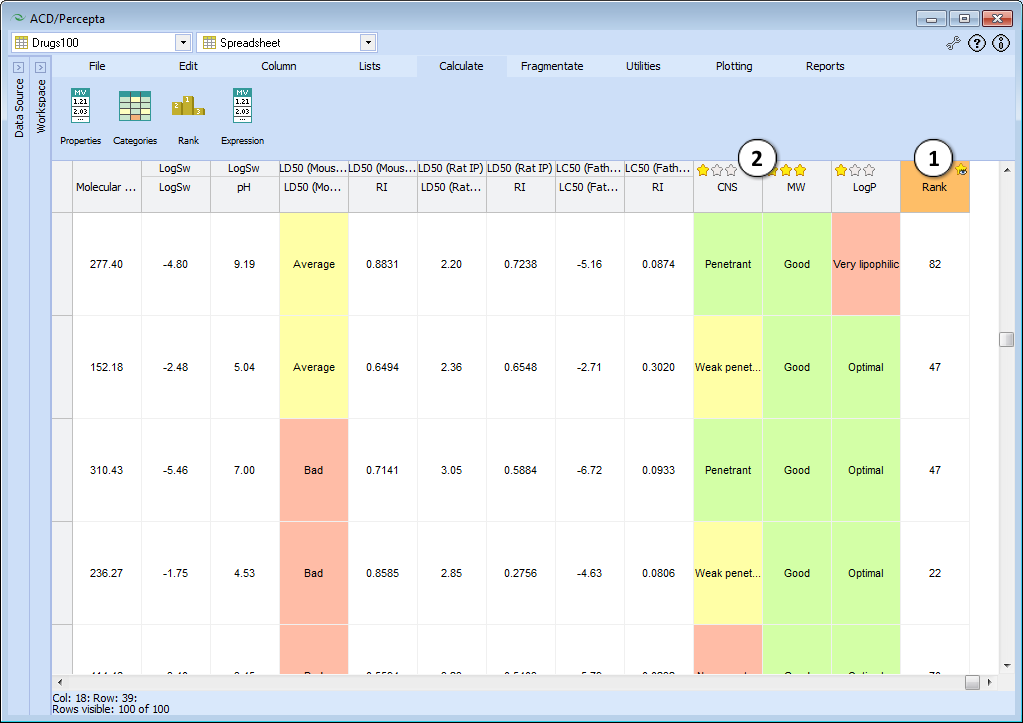
- Click to enable/disable the variable ranking score component weighting setup controls. These are automatically displayed on all the columns used in the corresponding rank calculation. If the spreadsheet contains more than one rank column , the variable ranking score component weighting setup controls can be activated for only one of them at a time, clicking “enable” on one of them will automatically disable the same controls of any other rank column active at the time.
- When active the column star ratings can be set up to differentiate between importance of various ranking score components. I.e. the fact that the property is within favorable or unfavorable range can have a non-uniform impact on the ranking score, depending on the star rating assigned to the column containing the categorized data for a particular property. Initially all the components are automatically assigned an equal weight.
NOTE 1: Throughout this document, the categories are referred by generic names "Good" (green), "Average" (yellow), "Bad" (red), and "Undefined" (gray). However, as shown in the screenshots above, the predefined profiling functions have distinct category descriptions that reflect the classification of the underlying properties, e.g. for Ames test: "Mutagenic" = "Bad", "Non-mutagenic" = "Good"; for HIA: "Highly absorbed" = "Good", "Moderately absorbed" = "Average", "Poorly absorbed" = "Bad", etc.
NOTE 2: In the ranking score calculation “Undefined” category is treated as a most favorable following “Good”. This is because of the fact that both “Average” and “Bad” are obviously not “Good” while “Undefined” still retains a positive shade in the perspective, because “Undefined” can be as well found out to be “Good”. This means that the compounds with “Undefined” categories still carry substantial potential and are more interesting than their counterparts classified as “Average” in terms of the same properties even despite the fact that they require some further investigation.
Expression Editor
The Expression Editor functions as a parser, allowing the user to create complex expressions using an easy-to-learn set of syntax rules. Expressions can be constructed using a set of mathematical and string functions, as well as logical and arithmetic operators.
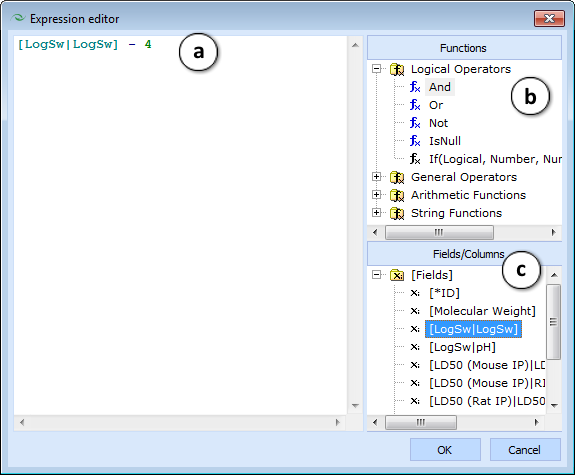
- The Edit window allows you to type constructs directly or insert functions and operators from the roll-down menus by double-clicking them.
- Functions/operators and fields appear in the roll-down menus. Click any function sub-menu to expand/collapse it.
- Roll-down menus can be viewed simultaneously by dragging them halfway up or down the pane.
The Expression Editor only accepts the listed functions.
Variables designate columns in a database spreadsheet.
- Variables are designated with brackets in the following manner - [variable] - and appear in a teal (greenish-blue) color. Example: [ID].
- Brackets are not allowed as part of a variable name but are meant to separate the variable from the other parts of a filter expression.
- Spaces following an open bracket "[" and before a close bracket "]" are allowed. Example: [ ID ]
- Spaces within a variable name are not allowed; the Expression Editor will automatically display these as syntax errors in a burgundy (purplish-red) color. Example: [I D]
- Text within a variable is not case sensitive. The following variable names are all identical: [ID] [Id] [iD] [id]
General operators appear in navy blue: +, -, /, *, <, >, <=, >=, <>, =.
Functions always appear in black.
Logical operators appear in black: And, Or, Not.
Arguments following functions must always be enclosed by parentheses that appear in navy blue. Example: Function(Argument)
Static constants can be used.
- Real number constants are designated in green. Decimal points designate fractions and minus signs designate negative numbers. Examples: 6, -7.45767.
- Scientific numbers are also recognized. Exponents can be designated using an upper or lower case “e”. Examples: -1.658476e-5, -1.62E2 = -162.
- String static constants are designated using single quotation marks in the following manner - ‘molecule’ - and appear in purple.
