Physicochemical Properties
Overview
The module performs a quick check on several useful properties characterizing the compound of interest in general. The results cover Lipinski-type properties (MW, TPSA, numbers of hydrogen bond donors and acceptors, etc.).
Interface
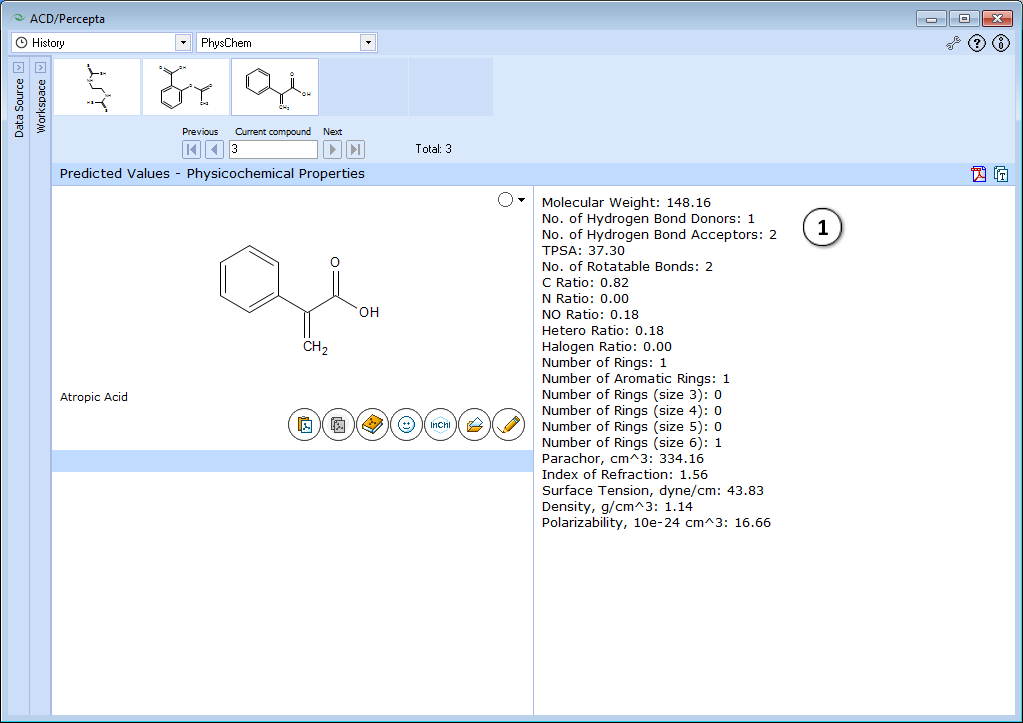
- Displays physicochemical properties.
Technical information
Algorithms for Calculating Basic Physicochemical Properties
At the heart of the additive-constitutive calculation algorithm of all physicochemical properties in ACD/Percepta lies the presumption that these properties can be estimated using additive atomic or group increments. Apart from molecular weight (MW), which is trivial to calculate, the algorithms may be divided into three general groups:
- Basic macroscopic properties: molar volume (MV), molar refractivity (MR), and parachor (Pr)
- Derived macroscopic properties: density (d), refractive index (n), and surface tension (γ)
- The dielectric constant ε (Permittivity)
Basic macroscopic properties such as molar volume (MV), molar refractivity (MR), and the parachor (Pr) are calculated first for the input structure. The atomic additive increments in such an algorithm depend on the bonds (single, double, aromatic, etc.) of this atom and on neighboring atoms. ACD/Percepta rapidly analyzes the input structure to determine the class of each atom, i.e., whether it is cyclic, aromatic, aliphatic, etc.
The prediction algorithms for density (d), refractive index (n) and surface tension (γ) are founded on well-known physicochemical formula which can be found in literature on physicochemical properties of compounds. They express d, n, and γ as functions of MV, MR, or Pr. Once the MV, MR, or Pr, have been predicted by additive means, it is straightforward to predict d, n, and γ using these formula.
The determination of the additive-constitutive atomic increments for MV, MR, and Pr were obtained internally by ACD/Labs scientists using large experimental databases relating structure to density, refractive index, and surface tension. The MV, MR, and Pr were recalculated from d, n, and γ. These parameters are proprietary information of ACD/Labs, Inc.
The prediction of the dielectric constant ε (permittivity) resembles very closely the prediction of boiling point, which is available as a separate Prediction Module in ACD/Percepta. Senior scientists at ACD/Labs discovered an additive function, which relates the dielectric constant to other macroscopic properties which can be additively treated, such as MV. Once this relationship was discovered, the additive-constitutive atomic increments for this function were obtained using large databases consisting of molecular structures and their observed dielectric constants. Using the function and estimated MV for the input structure, its dielectric constant can be quickly predicted.
Molar Volume, MV
By definition,
MV = MW / d
ACD/Percepta calculates molar volume from additive increments. The additive atomic increments were obtained using a database of density and calculated MW. Note: The obtained MV value is used as an input parameter for further calculations, but is not displayed in the module interface itself.
Molar Refractivity, MR
The Lorentz-Lorenz equation relates refractive index, density, and refractive index:
MR = (n2 - 1) / (n2 + 2) x MW / d
ACD/Percepta calculates molar refractivity from additive increments. The additive atomic increments were obtained using a database of density, refractive index, and calculated MW.
Note: The obtained MR value is used as an input parameter for further calculations, but is not displayed in the module interface itself.
Parachor, Pr
By definition,
Pr = (MW / d) γ1/4
ACD/Percepta calculates the parachor from additive increments. The additive atomic increments were obtained using a database of density, surface tension, and calculated MW.
Density, d
By definition,
d = MW / MV
ACD/Percepta calculates the density from MW and the calculated molar volume (see above).
Refractive Index, n

ACD/Percepta calculates the refractive index from the molar volume and molar refractivity, both of which are calculated as above.
Surface Tension, γ
By definition,
γ = (Pr / MV)4
ACD/Percepta calculates the surface tension from calculated MV (see above) and calculated Pr (see above).
Dielectric Constant, ε (Permittivity)
By definition,
f(ε) = f(MV, Additive Function)
ACD/Percepta calculates the dielectric constant from calculated MV (see above) and a proprietary empirical additive function.
Polarizability
This property is calculated from the Molar Refractivity (MR) as follows:
Polarizability = 0.3964308∙MR
Correlation Statistics with Experimental Data
Distribution of Molar Refractivity Prediction Error
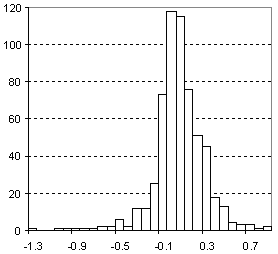
| Vertical scale: | Number of Tested Structures |
| Horizontal scale: | ACD/Molar Refractivity Estimation Error |
| Number of Tested Structures | 592 |
MRexp = 0.99901 (±0.00067) MRcalc + 0.026 (±0.025) R = 0.999867, SD = 0.23
Distribution of Molar Volume Prediction Error
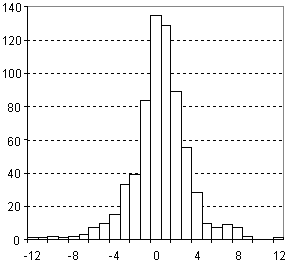
| Vertical scale: | Number of Tested Structures |
| Horizontal scale: | ACD/Molar Volume Estimation Error |
| Number of Tested Structures | 671 |
MVexp = 0.9998 (±0.0020) MVcalc + 0.18 (±0.29) R = 0.998626, SD = 2.74
Distribution of Parachor Prediction Error
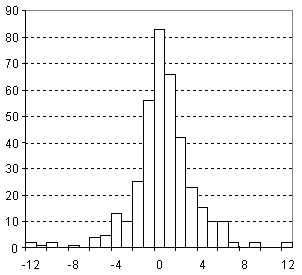
| Vertical scale: | Number of Tested Structures |
| Horizontal scale: | ACD/Parachor Estimation Error |
| Number of Tested Structures | 377 |
Pr, exp = 0.9978 (±0.0015) Pr, calc + 0.68 (±0.46) R = 0.99958, SD = 3.11
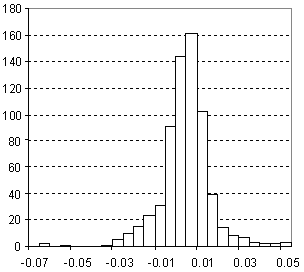
Distribution of Refractive Index Prediction Error
| Vertical scale: | Number of Tested Structures |
| Horizontal scale: | ACD/Refractive Index Estimation Error |
| Number of Tested Structures | 665 |
n20exp = 0.98035 (±0.0073) n20calc + 0.028 (±0.011) R = 0.982, SD = 0.012
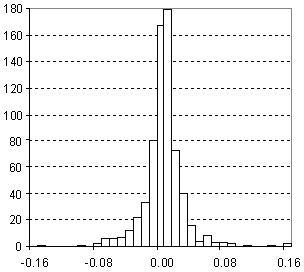
Distribution of Density Prediction Error
| Vertical scale: | Number of Tested Structures |
| Horizontal scale: | ACD/Density Estimation Error |
| Number of Tested Structures | 671 |
d20exp = 0.9947 (±0.0036) d20calc + 0.0052 (±0.0036) R = 0.995683, SD = 0.028
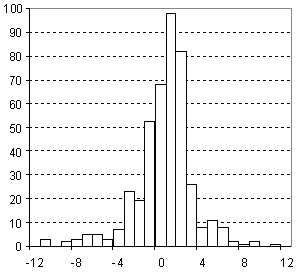
Distribution of Surface Tension Prediction Error
| Vertical scale: | Number of Tested Structures |
| Horizontal scale: | ACD/Surface Tension Estimation Error |
| Number of Tested Structures | 432 |
st20exp = 0.998 (±0.018) st20calc + 0.08 (±0.53) R = 0.934720, SD = 2.84
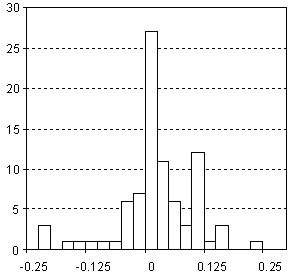
Distribution of Dielectric Constant (Permittivity) Prediction Error
| Vertical scale: | Number of Tested Structures |
| Horizontal scale: | Dielectric Constant (Permittivity) Estimation Error |
| Number of Tested Structures | 85 |
| Note: Derived only for hydrocarbons |
εexp = 1.005 (±0.033) εcalc - 0.013 (±0.072) R = 0.9588, SD = 0.079
Molecular Polar Surface Area (Å2)
Fast and reliable estimation of molecular transport properties is one of the key factors accelerating the process of drug discovery and development. Traditionally, calculated values of the octanol-water partition coefficient have been used for this purpose. In recent years, several new parameters have been introduced for absorption prediction, including molecular size and shape descriptors, hydrogen-bonding capabilities, and surface properties.
Another helpful parameter for the prediction of absorption is the polar surface area (PSA), defined as the sum of the surfaces of polar atoms in a molecule. PSA is a descriptor that was shown to correlate well with passive molecular transport through membranes, and therefore, allows the prediction of the transport properties of drugs. The calculation of PSA, however, used to be rather time consuming because of the necessity to generate a reasonable 3D molecular geometry and the calculation of the surface itself.
A new approach for the calculation of PSA is based on the summation of tabulated surface contributions of polar fragments. The method, termed topological PSA (TPSA), provides results that are practically identical to the 3D PSA, while the computation speed is 2–3 times of a magnitude faster.
Reference: Peter Ertl, Bernhard Rohde, and Paul Selzer. Fast calculation of Molecular Polar Surface Area as a Sum of Fragment-based contributions and its Application to the prediction of drug transport properties. J. Med. Chem. 2000, 43, 3714–3717. [1]