Single Record View
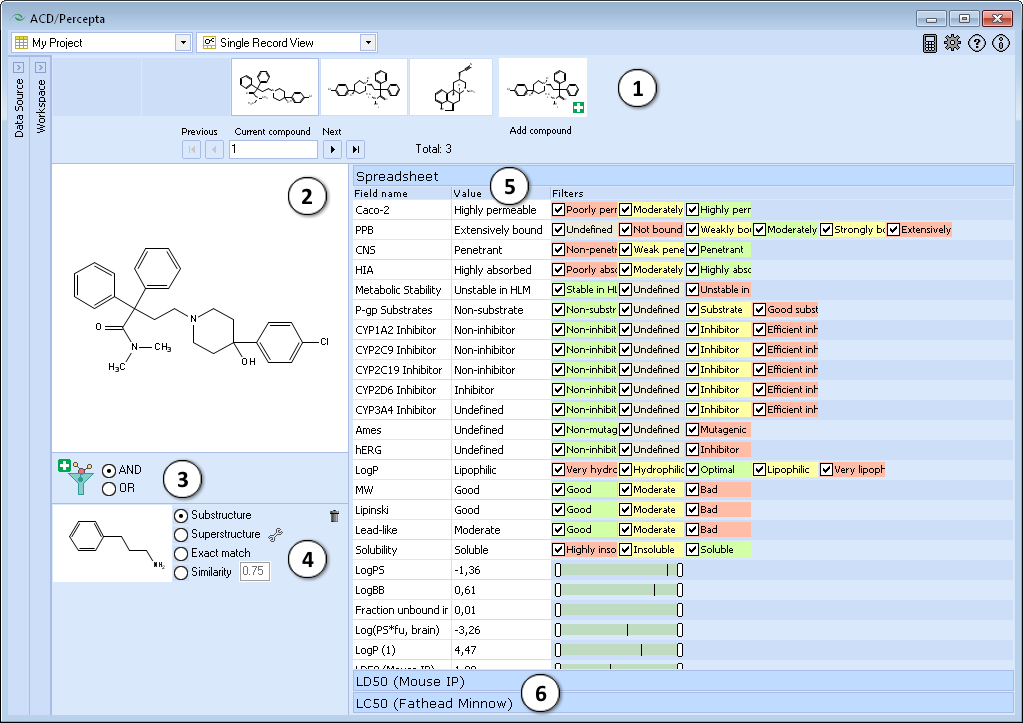
The Single Record View workspace in ACD/Percepta presents the the same kind of information about the compounds in your projects as the Spreadsheet, but instead showing the entire data set in tabular form, it displays the data for one compound at a time, similarly to Prediction modules and Profilers.

- Navigation Bar
The Navigation Bar appears in all workspaces except the Spreadsheet. It displays presented structure and two previous as well as two next stuctures in the corresponding dataset. If no dataset is selected, the Navigation Bar displays the history of performed calculations.
When the compound outside of the dataset is used as an input structure for calculation, the user can add it to the current dataset:

- Click the
 pictogram to replace the current structure with the new one. All subsequent calculations will be performed automatically for the added compound.
 - Click the
 pictogram to add new compound to the current dataset. It will appear as the last record in the dataset and all subsequent calculations will be performed automatically.
 - The structure browse bar displays the active structure number and the total number of records in the current dataset. Scroll through the database using the browse buttons: First/Last record, Previous/Next record or pressing the up/down arrow keys on the keyboard to go to the next/previous record. Type a record number to view it directly.
- Click the
- Structure Pane
The Structure Pane displays a 2-D representation of the chemical structure of the currently selected compound.
Differently to the Prediction modules, the Structure Pane in the Single Record View does not display the structure editing toolbar. - Add a new structure filter and set the logical operator to combine multiple filter conditions if present.
- The interface for setting up the filter conditions is the same as in the Spreadsheet. Please refer to the Structure Filter section for more details.
- The Spreadsheet roll-down pane displays all available fields in the project, the respective values for the current compound, and the filter conditions set for those fields. The filter conditions are editable and they can be altered in the same manner as one would do it in the Spreadsheet. The changes made here are preserved when switching to the Spreadsheet and the effect of the filters is immediately refelected by the number of compounds satisfying all conditions displayed in the Navigation bar. For numerical fiels, the values stored for the current compound are indicated by black vertical lines in the filter sliders.
- Additional roll-down panes are displayed for each column with Multiple Entries format assigned. The interface of this pane is identical to the Multiple Entries Editor available in the Spreadsheet.
Note: The roll-down panes can be viewed simultaneously by dragging them partway up or down the pane