pKa
Overview
The acid dissociation constant, Ka, is a measure of the tendency of a molecule or ion to keep a proton (H+) at its ionization center(s). It is related to the ionization ability of chemical species and is a core property that defines chemical and biological behaviour.
Features
- Includes two different predictive algorithms – ACD/pKa Classic and ACD/pKa GALAS.
- Calculates accurate acid and base pKa constants (pKa = -log Ka) under standard conditions (25°C and zero ionic strength) in aqueous solutions for every ionizable group within organic structures.
- Provides confidence intervals for all estimations indicating their accuracy.
- Gives an explicit insight into processes running during each ionization stage. Contains a number of other useful features depending on the selected prediction algorithm.
Interface
ACD/pKa Classic

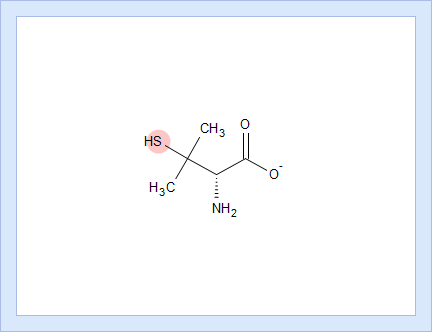
- Ionizable groups are highlighted using color shading (red for acid, blue for base, purple for amphoteric ionization centers). More intensive shading denotes strongest acid and base groups
- Strongest acid and base pKa values including reliability range in ±log units
- List of pKa constants for all stages of ionization
- List of dissociation stages (DS) corresponding to different pKa values.
- Hover over to see the screentip showing the respective dissociation reaction:
- Click the appropriate tab to display the protocol, according to which the pKa value for that dissociation stage was calculated.
- Click the structure fragment to see it highlighted in the Structure pane.

ACD/pKa GALAS

- Ionizable groups are highlighted using color shading (red for acid, blue for base, purple for amphoteric). More intensive shading denotes strongest acid and base groups
- Strongest acid and base pKa values including reliability range in ±log units
- List of pKa constants for all stages of ionization
- List of partial ionization reactions (microstages) responsible for each ionization stage. Contribution of each microstage to the final pKa value is given in percent
- Hover over to see the screentip:
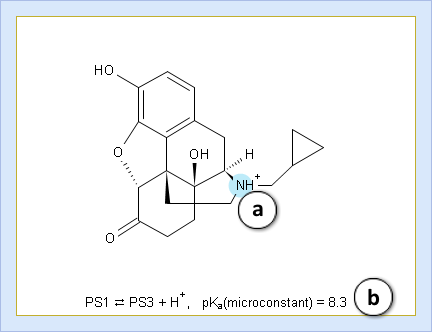
- a. Color shading marks the ionization center
- b. Dissociation reaction and its pKa microconstant
- Click the appropriate tab to select the type of plot to be displayed
- Net charge vs. pH plot
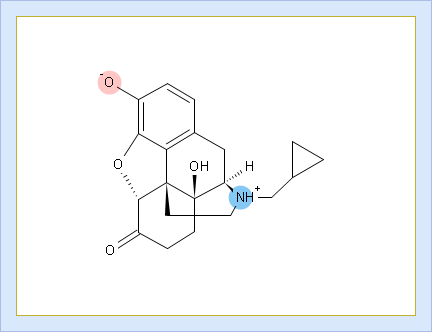
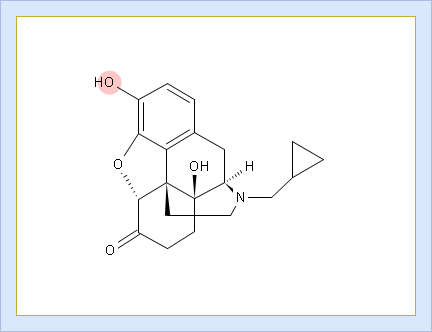
- Protonation states of the molecule. The selected protonation state (PS2 in this example) is displayed in the screentip with ionized atoms marked by color-shading:
- Click to view the Net Charge vs. pH table. Fractions of the ionic species having a particular net charge are displayed at selected points on the pH scale including physiologically relevant pH values (1.7, 4.6, 6.5, 7.4)
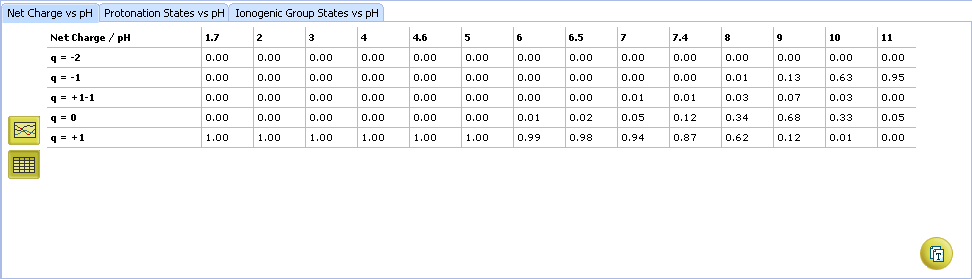
- Click and drag the slider to see calculated fractions of different ionic forms at precise pH value displayed on the right.
- Calculated fractions of different ionic forms at selected pH.


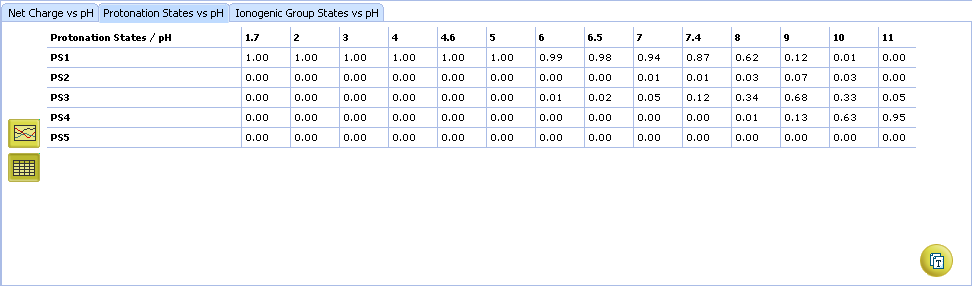
- Protonation State vs. pH plot
- Click the label of a protonation state to show / hide its curve on the plot
- Fractions of different protonation states at selected pH
- Click to view the Protonation State vs. pH table


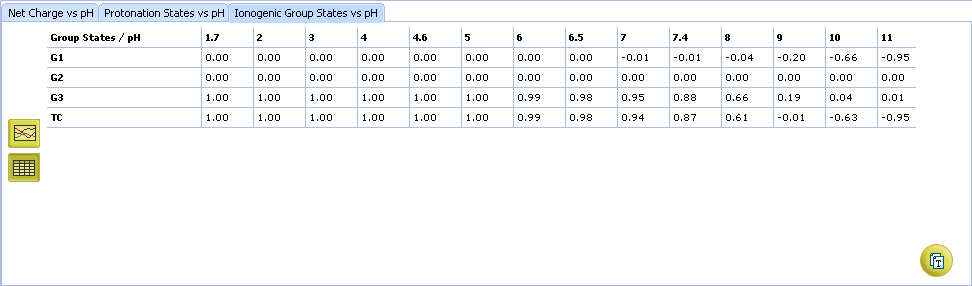
- Ionogenic Group State vs. pH plot
- Click the label of a ionogenic group to toggle its curve. Hover over the label to view a screentip with the selected ionogenic group shaded (G1 in this example):
- TC – total charge of all ionogenic groups in the molecule
- Click to view the Ionogenic Group State vs. pH table


Technical information
The Different Available Models
The pKa prediction module offers two different predictive algorithms within ACD/Percepta software – ACD/pKa Classic and ACD/pKa GALAS.
ACD/pKa Classic
The algorithm uses Hammet-type equations and electronic substituent constants (σ) to predict pKa values for ionisable groups. Effects considered by the software include tautomeric equilibria, covalent hydration, and resonance effects in α, β-unsaturated systems.
Hammet-Type Equations — every ionizable group is characterized by several Hammet-type equations that have been parameterized to cover the most popular ionizable functional groups.
Sigma constants — the internal training set contains >3,000 derived experimental electronic constants. When the required substituent constant is not available from the experimental database, one of four algorithms are used to describe electronic effect transmissions through the molecular system.
Specific features of this particular algorithm include:
- Number of compounds in the internal training set: 15,932 (>30,000 pKa values). Data sources: various articles from peer-reviewed scientific journals
- Presents a detailed calculation protocol on how prediction has been carried out (including Hammett-type equations, substituent constants, and literature references where available).
- To improve prediction accuracy and make the model relevant to in-house chemical space or a particular project, the ACD/pKa Classic prediction model offers the ability for training with user provided experimental data. Training is user-friendly, and may be switched on, off, or certain training sets used for different predictions, putting full control in your hands.
ACD/pKa GALAS
Estimation of ionization constants using this algorithm is a multi-step procedure involving estimation of pKa microconstants for all possible ionization centers in a hypothetical state of an uncharged molecule (“fundamental microconstants”), numerous corrections of these initial pKa values according to the surrounding of the reaction center and calculation of charge influences of ionized groups to the neighbouring ionization centers. Calculation routine utilizes a database of 4,600 ionization centers, a set of ca. 500 various interaction constants and four interaction calculation methods for different types of interactions, producing a full range of microconstants from which pKa macroconstants are obtained. This allows for a simulation of complete distribution plot of all protonation states of the molecule at different pH conditions.
Specific features of this particular algorithm include:
- Number of compounds in the internal training set: 17,593 (>20,000 ionization centers). Data sources:
- Reference books:
- The Merck Index. An Encyclopedia of Chemicals, Drugs, and Biologicals, O'Neil, M.J., Smith, A., Heckelman, P.E., Budavari, S., Eds. 13th Edition, Merck & Co., Inc., Whitehouse Station, NJ, 2001
- Therapeutic Drugs, Dolery, C., Ed. 2nd Edition, Churchill Livingstone, New York, NY, 1999
- Clarke's Isolation and Identification of Drugs, Moffat, A.C., Jackson, J.V., Moss, M.S., Widdop, B., Eds. 2nd Edition, The Pharmaceutical Press, London, 1986
- Various articles from peer-reviewed scientific journals
- Reference books:
- Provides graphical/tabular representation of the obtained predictions in the form of pH dependency of:
- Net molecular charge
- Distribution of protonation states
- Average charge of each ionization centre
Internal pKa database
To complete the picture, pKa predictive module can be accompanied by a reference database containing high quality experimental data compiled from the literature for nearly 16,000 individual chemical compounds. With this database at hand you can always check what pKa values have been reported in practice for the molecules that are related to your compound of interest.