PK Explorer
Overview
PK Explorer module is a tool for exploring pharmacokinetic curves using physicochemical parameters of drugs as inputs for calculations. It provides the possibility to explore the dependences of oral bioavailability and drug plasma levels on physico-chemical parameters of compounds and dose. It also simulates drug plasma concentration–time (Cp–t) curve. Differential equations describing solubility in the gastrointestinal tract, passive-absorption, first-pass effect in liver and gut, volume of distribution and total body clearance are considered by PK Explorer.
Features
PK Explorer simulates the following dependencies:
- %F–LogP – dependence of oral bioavailability on LogP at defined dose
- Cp(Max)–LogP – dependence of maximum achievable drug concentration on LogP at defined dose
- %F–Dose – bioavailability–dose relationship.
- Cp(Max)–Dose – shows maximum achievable drug plasma levels at different doses
- Cp–Time – simulation of plasma concentration–time curves. Two curves are simulated corresponding for drug plasma levels after oral and intravenous administration.
- Required parameters characterizing absorption (ka), total body clearance (ke), solubility in gastrointestinal tract (SolGI), volume of distribution (Vd), presystemic metabolism in gut and liver (First-pass) are estimated automatically. However, since in silico predictions of these PK parameters may often lead to significant errors in estimation of drug plasma concentration, any of these parameters can be changed by entering the new value, and PK simulation can be repeated with new parameters
- Predicted values of ka, ke, SolGI may also be recalculated if altered values of main physicochemical determinants (LogP and pKa) are entered.
- Along with graphical simulations, numerical values of relevant pharmacokinetic parameters are calculated, including maximum achievable plasma level and the corresponding time (Cp(max) and Tmax), area under the concentration time curve (AUC) after oral and intravenous administration, as well as oral bioavailability (%F).
Interface

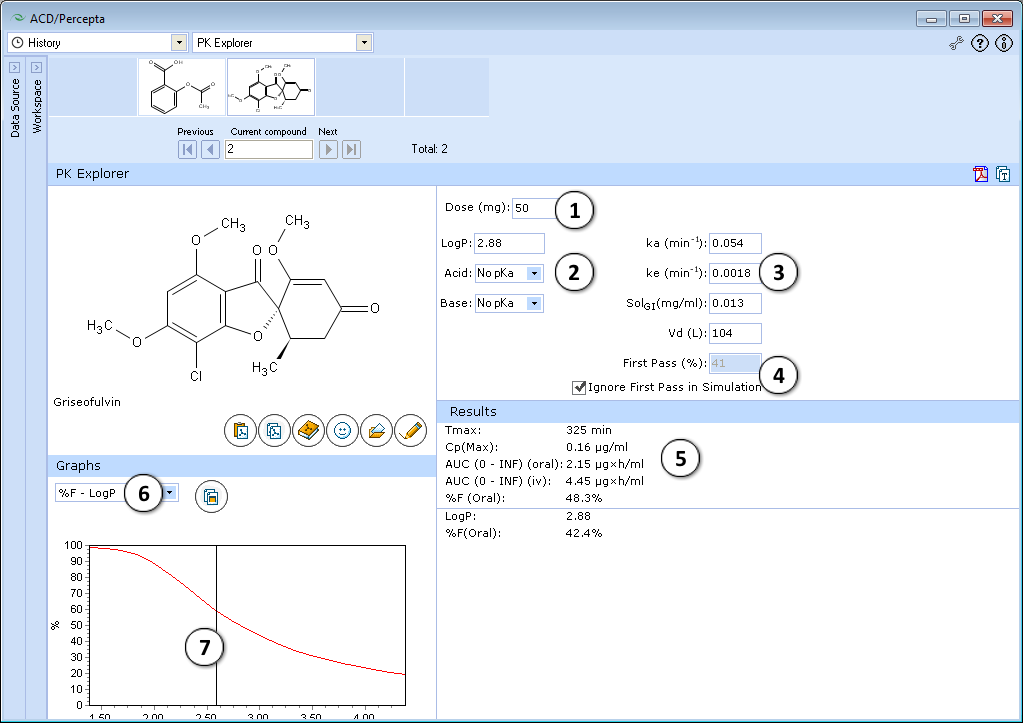
- 50 mg is the default oral drug dose. Enter any dose for PK exploring.
- Hydrophobicity (logP) and ionization (pKa) are the principal descriptors in the predicting of starting (input) pharmacokinetic parameters (ka, ke, Vd, SolGI). These descriptors are calculated in silico (see LogP and pKa for background), but the quality of PK exploring can be significantly improved by entering experimental logP and pKa and repeating calculations.
- Required parameters characterizing absorption (ka), total body clearance (ke), solubility in gastrointestinal tract (SolGI), volume of distribution (Vd), presystemic metabolism in gut and liver (First-pass) are calculated automatically. Any of these parameters can be changed by entering the new value, and PK simulation can be repeated with new parameters.
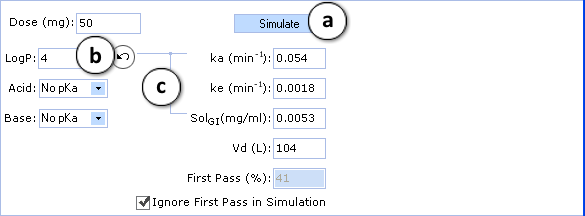
- a. Click to perform a new simulation using the currently specified parameter values.
- b. Click to reverse to an automatically calculated property value (logP in the given figure) for a compound.
- c. Lines indicate which PK input parameters (ka, SolGI) are automatically recalculated according to new logP (or pKa) values.
- The effect of presystemic metabolism on drug plasma levels is ignored by default. Uncheck to activate it and type your value of presystemic metabolism in the box.
- The following simulated parameters are presented:
- tmax – time when drug level in plasma achieves maximum
- Cpmax – drug plasma concentration at this time
- AUC0→∞ (oral) and AUC0→∞ (iv) are area under the plasma concentration–time curve after oral and intravenous administration of drug
- Select different types of simulated graphs:

- %F–LogP – dependence of oral bioavailability on logP at defined dose
- Cp(Max)–LogP – dependence of maximum achievable drug concentration on logP at defined dose
- %F–Dose – bioavailability–dose dependence
- Cp(Max)–Dose – shows maximum achievable drug plasma levels at different doses
- Cp–Time – simulated plasma concentration–time curve
- Graphs are interconnected with the lower table. In the presented example, drag the slider over the range of logP values to see the exact values of %F oral

Certain types of graphs have additional visualization options:

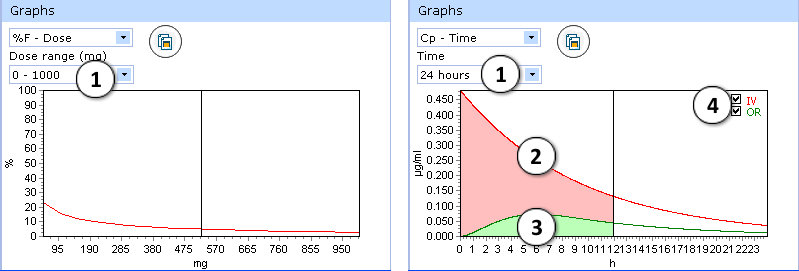
- %F-Dose graph:
- select desired dose range to be displayed
- Cp(max)-Dose graph:
- Select the time interval to be displayed.
- Two drug plasma concentration–time curves are presented in the Cp-Time graph.
The red curve shows drug concentration changes with time after intravenous administration. - The green curve indicates changes of drug concentration with time after oral administration.
- Check/uncheck to show/hide the “intravenous” or “oral” curve on the plot.