pKa: Difference between revisions
Updated for 2023 release |
|||
| Line 20: | Line 20: | ||
<br /> | <br /> | ||
# Ionizable groups are highlighted using color shading (red for acid, blue for base, purple for amphoteric ionization centers). More intensive shading denotes strongest acid and base groups | # Ionizable groups are highlighted using color shading (red for acid, blue for base, purple for amphoteric ionization centers). More intensive shading denotes strongest acid and base groups | ||
# Select which type of pKa values to predict: | |||
#* Apparent pKa: simulates the actual ionization of the compound in aqueous solution, accounting for the protonation states of other ionizable groups at relevant pH | |||
#* Single pKa: estimates theoretical pKa that would be observed if the considered ionization center would be the only ionizable group in the molecule, so that the remainder of the molecule would always stay electrically neutral | |||
# Strongest acid and base pK<sub>a</sub> values including reliability range in ±log units | # Strongest acid and base pK<sub>a</sub> values including reliability range in ±log units | ||
# List of pK<sub>a</sub> constants for all stages of ionization | # List of pK<sub>a</sub> constants for all stages of ionization | ||
Latest revision as of 09:29, 26 July 2023
Overview
The acid dissociation constant, Ka, is a measure of the tendency of a molecule or ion to keep a proton (H+) at its ionization center(s). It is related to the ionization ability of chemical species and is a core property that defines chemical and biological behaviour.
Features
- Includes two different predictive algorithms – ACD/pKa Classic and ACD/pKa GALAS.
- Calculates accurate acid and base pKa constants (pKa = -log Ka) under standard conditions (25°C and zero ionic strength) in aqueous solutions for every ionizable group within organic structures.
- Provides confidence intervals for all estimations indicating their accuracy.
- Gives an explicit insight into processes running during each ionization stage. Contains a number of other useful features depending on the selected prediction algorithm.
Interface
ACD/pKa Classic
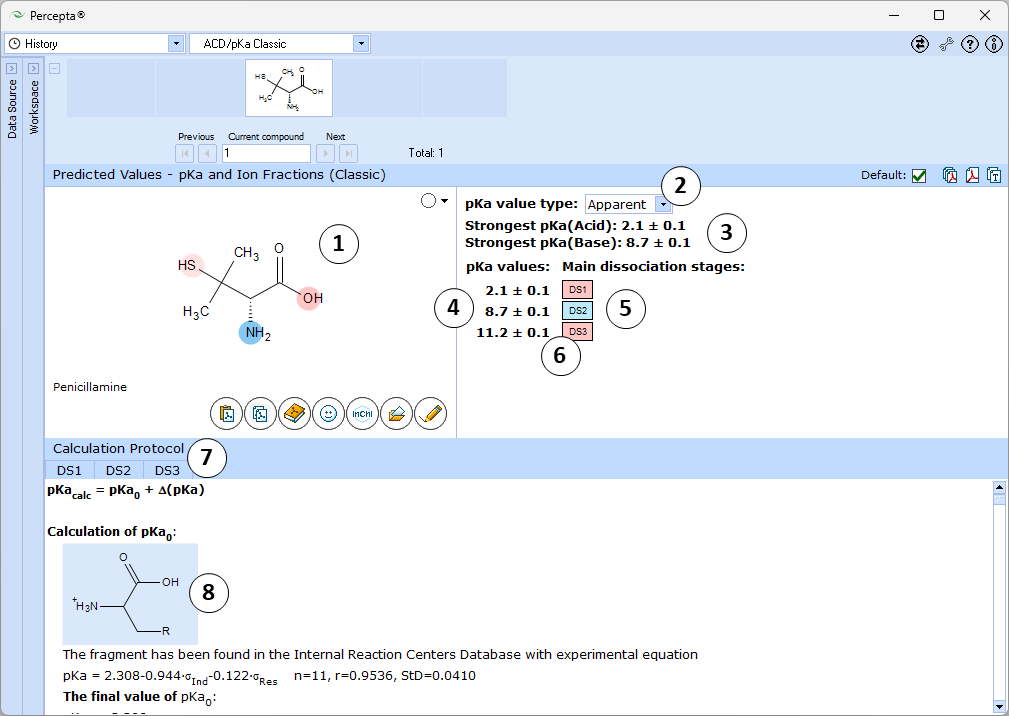
- Ionizable groups are highlighted using color shading (red for acid, blue for base, purple for amphoteric ionization centers). More intensive shading denotes strongest acid and base groups
- Select which type of pKa values to predict:
- Apparent pKa: simulates the actual ionization of the compound in aqueous solution, accounting for the protonation states of other ionizable groups at relevant pH
- Single pKa: estimates theoretical pKa that would be observed if the considered ionization center would be the only ionizable group in the molecule, so that the remainder of the molecule would always stay electrically neutral
- Strongest acid and base pKa values including reliability range in ±log units
- List of pKa constants for all stages of ionization
- List of dissociation stages (DS) corresponding to different pKa values.
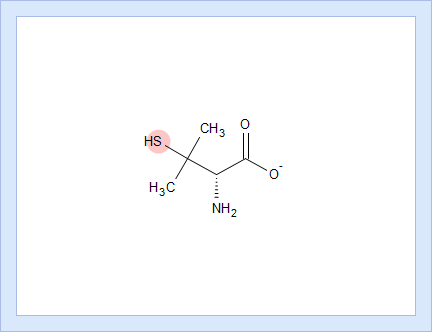
- Hover over to see the screentip showing the respective dissociation reaction:
- Click the appropriate tab to display the protocol, according to which the pKa value for that dissociation stage was calculated.
- Click the structure fragment to see it highlighted in the Structure pane.
ACD/pKa GALAS
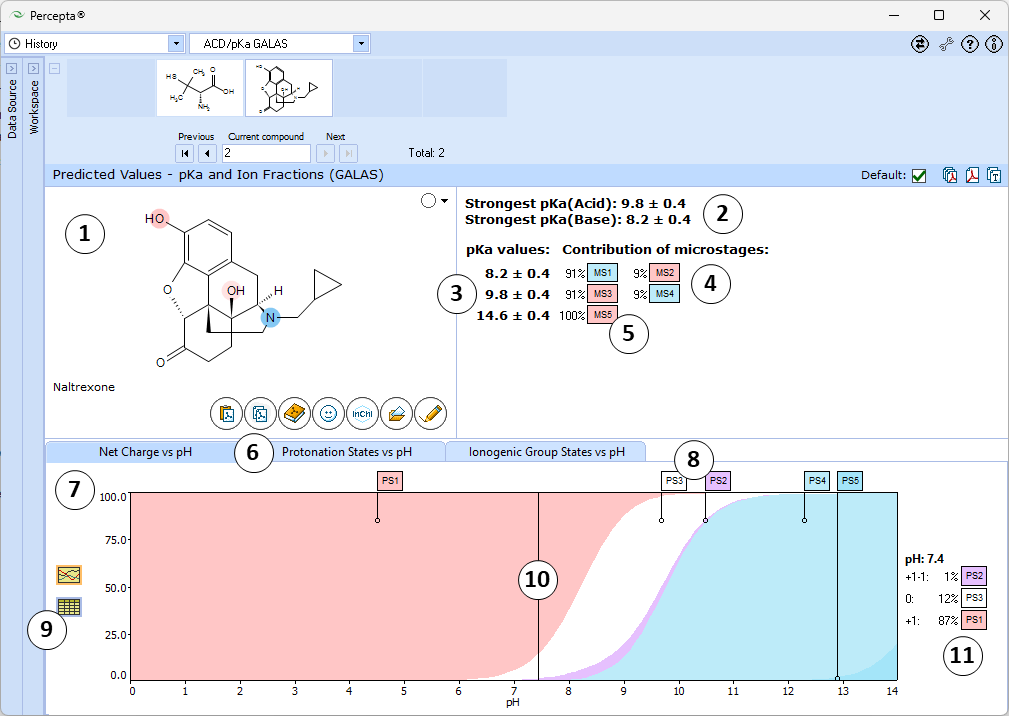
- Ionizable groups are highlighted using color shading (red for acid, blue for base, purple for amphoteric). More intensive shading denotes strongest acid and base groups
- Strongest acid and base pKa values including reliability range in ±log units
- List of pKa constants for all stages of ionization
- List of partial ionization reactions (microstages) responsible for each ionization stage. Contribution of each microstage to the final pKa value is given in percent
- Hover over to see the screentip:
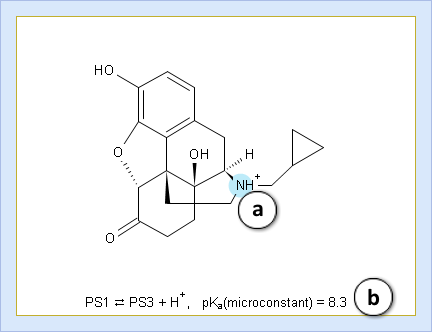
- a. Color shading marks the ionization center
- b. Dissociation reaction and its pKa microconstant
- Click the appropriate tab to select the type of plot to be displayed
- Net charge vs. pH plot
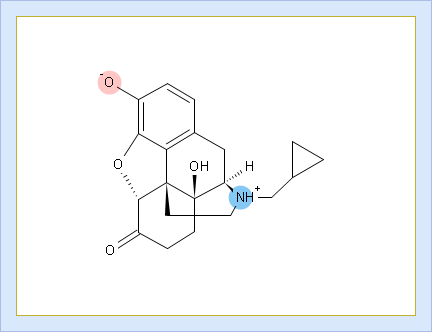
- Protonation states of the molecule. The selected protonation state (PS2 in this example) is displayed in the screentip with ionized atoms marked by color-shading:
- Click to view the Net Charge vs. pH table. Fractions of the ionic species having a particular net charge are displayed at selected points on the pH scale including physiologically relevant pH values (1.7, 4.6, 6.5, 7.4)

- Click and drag the slider to see calculated fractions of different ionic forms at precise pH value displayed on the right.
- Calculated fractions of different ionic forms at selected pH.
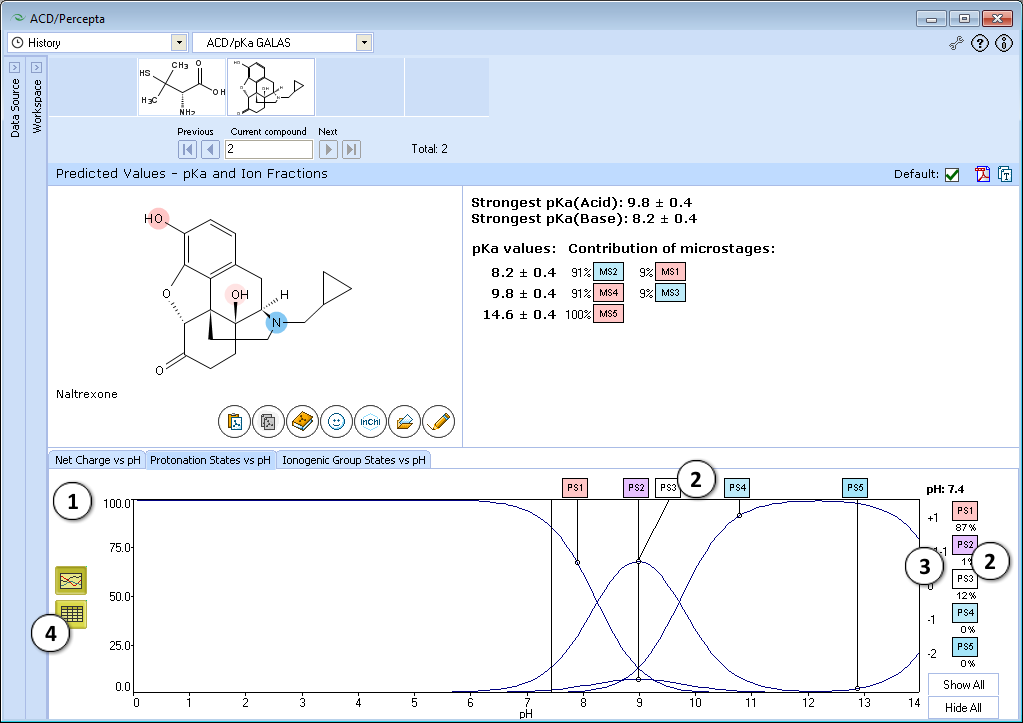
- Protonation State vs. pH plot
- Click the label of a protonation state to show / hide its curve on the plot
- Fractions of different protonation states at selected pH
- Click to view the Protonation State vs. pH table

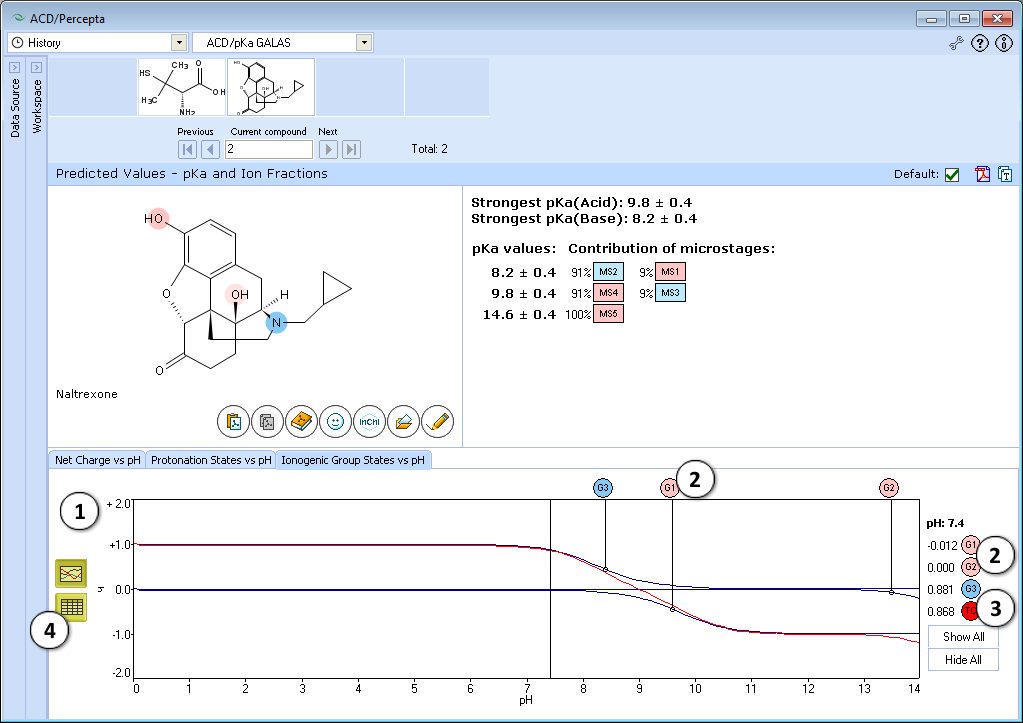
- Ionogenic Group State vs. pH plot
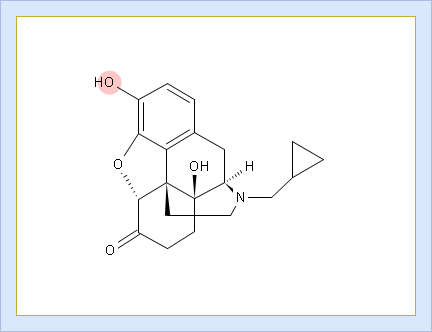
- Click the label of a ionogenic group to toggle its curve. Hover over the label to view a screentip with the selected ionogenic group shaded (G1 in this example):
- TC – total charge of all ionogenic groups in the molecule
- Click to view the Ionogenic Group State vs. pH table

Technical information
Introduction to pKa
The pKa is a measure of the tendency of a molecule or ion to keep a proton, H+, at its ionization center(s). It is related to ionization capabilities of chemical species. The more likely ionization occurs, the more likely a species will be taken up into aqueous solution, because water is a very polar solvent (its dielectric constant, ε20 = 80). If a molecule does not readily ionize, then it will tend to stay in a non-polar solvent such as cyclohexane (ε20 = 2) or octanol (ε20 = 10). In biological terms, pKa is thus an important concept in determining whether a molecule will be taken up by aqueous tissue components or the lipid membranes. It is also closely related to the concepts of pH (the acidity of solution) and logP (the partition coefficient between immiscible liquids).
The equilibrium acid ionization constant, Ka, expresses the ratio of concentrations for the reaction:
HA + H2O → H3O+ + A-
Ka = [H3O+] [A-] / [HA]
where, by convention, it is assumed that the concentration of water is constant, and it is absorbed into the Ka definition.
The acid ionization constant varies by orders of magnitude. For example, at 25°C:
- acetic acid: Ka = 1.8 x 10⁻⁵
- phenol: Ka = 1.0 x 10⁻¹⁰
It is easier to refer to such extreme numbers on a logarithmic scale and, again by convention, "p" is used to denote the negative logarithm (base 10):
pKa = -log(Ka)
The Ka values of the compounds above are then easily converted to pKa values:
- acetic acid: pKa = -log(1.8 x 10⁻⁵) = 4.756
- phenol: pKa = -log(1.0 x 10⁻¹⁰) = 10.0
There is an essential difference between interpreting the pKa values for molecules vs. ions. A molecule which loses a proton ionizes:
HA + H2O → H3O+ + A-
and so a low pKa value denotes good aqueous solubility.
An ion which loses a proton, however, de-ionizes:
HB+ + H2O → H3O+ + B
and so a high pKa value denotes good aqueous solubility.
Note that there is no intrinsic reason to rule out pKa values less than 0 or greater than 14. For example, sulfuric acid, H2SO4, has a negative pKa for the loss of its first proton:
H2SO4 → HSO4- + H+ (pKa < 0)
although normally experiment can only measure pKa between 1 and 13.
Ionization Centers
The pKa determination depends on the presence of heteroatoms such as oxygen or nitrogen. Although in principle a pKa value could be calculated for any atomic center, including carbon, in practice the extrapolation is poor for systems which have a very low amount of ionization. For example, the C–H bonds in methane have such highly covalent character that
CH4 + H2O → CH3- + H3O+
has a vanishingly small probability of occurring. Some C-H bonds do have measurable ionic character, and these are calculated by ACD/pKa. For example, the C–H bond of the methylene group at the 2-position in 1,3-cyclopentanedione is highly polarized; its pKa is predicted to be about 8.9:

Normally, however, a heteroatom is part of the ionization center, and ACD/pKa is designed to test for the presence of heteroatoms which are capable of forming bonds with sufficient ionic character to have measurable pKa values, thus enabling reasonable prediction of pKa for related compounds.
Statistical Factor
The approximated calculation of constants will yield the statistical factor which takes into account identical protonation sites. Here is how the statistical factor is defined by leading authorities:
"When a polybasic acid has n groups, each of which has an equal probability of losing a proton, the observed pKa will be less by (log n) than the pKa of a closely related monobasic acid. This "statistical effect" arises because there are n equivalent ways of losing a proton but only one site to which the proton can be restored. Similarly, for second proton loss, the correction becomes (log((n – 1) / 2), then (log((n – 2) / 3), and so on. Thus, for a molecule such as butanedioic acid (HOOC–CH2–CH2–COOH), which has two identical acidic groups, loss of a proton from either group leads to the same monoanion. The consequence is that the first ionization constant, pKa1, for the dibasic acid is twice as large as that for the closely related monobasic acid, that is, the observed pKa1 is 0.3 (= log2) units less than would be expected from a consideration of factors other than probability. Conversely, the monoanion has only one ionizable proton whereas the dianion has two identical sites for proton addition, so that the second ionization step, pKa2, appears to be weaker by a factor of two, and the observed pKa2 to be greater by 0.3 than anticipated. Similarly, for a base with n basic centers, the measured pKa ["apparent pKa" in ACD/pKa] of greatest magnitude, pKaN, will be greater than anticipated by log n, and so on."
D. D. Perrin, Boyd Dempsey and E. P. Serjeant, pKa Prediction for Organic Acids and Bases, 1981, pp.16–17.
Experimental Measurement of pKa
When comparing calculated pKa values with experimentally determined data, it is wise to bear in mind how these measurements are carried out.
The determination of pKa is based on pH measurements for a series of mixtures of the acid and its salt. For pKa values in the range 2–12, this is frequently done by titrimetric methods. The pH is converted to proton molality, and then Ka is determined by measuring (or estimating) the activity coefficients of species in solution. Note that the temperature, ionic strength, and reference solutions used in these determinations can influence the measured pKa substantially. For example, benzoic acid was determined to have a pKa of 4.2 by one experimental group and 4.0 by another.
Another standard method is the spectrophotometric determination of pKa. This is particularly recommended for very small quantities of sample, or for poorly soluble sample. A refinement of this method requires an estimate of the spectra for each form from the data. The pKa values are determined by nonlinear curve fitting, assuming good initial estimates can be chosen. In theory, any kind of spectral data can be used—UV-Vis, IR, NMR, etc., provided that the pH of the solution in which the spectrum was obtained can be measured. A plot of absorbance versus pH will show asymptotes at the absorbance of the conjugate acid and base forms of the molecule. Each wavelength gives different asymptotes, but the same inflection point. Data at enough wavelengths will generate the spectra of the conjugate acid and base forms, even if they can't be measured experimentally, say, for molecules with pKa outside of the range 2–12. The (common) inflection point is the pKa. For molecules with multiple ionization sites, a sum of S-shaped curves that need to be deconvolved is obtained. Without good initial estimates, the calculations can be tedious. The better the initial estimate, the faster the convergence. ACD/pKa can provide good initial estimates for these calculations.
Just as there are aspects of experimental design which affect the accuracy of a pKa determination, there are also aspects to the physical solution which can lead to apparent disagreement between the calculated and measured pKa. For example, one factor which may cause a discrepancy between calculated and experimentally measured pKa values is the presence of a non-negligible tautomeric ratio. ACD/Percepta automatically checks for tautomers when a structure is entered in the Prediction module Workspace, and to check for tautomers in Spreadsheet Workspace, choose Check Tautomers command from the Utilities menu.
Database of Experimental pKa Values
The internal database contains 15,924 structures with more than 31,000 experimental values under different temperatures and ionic strengths in purely aqueous solutions. In ACD/Percepta, the database is directly accessible and searchable as Databases\pKa data source, and each experimental value is provided with a reference to the original literature. No pKa values in organic solvents or aqueous-organic mixtures are included.
Description of ACD/pKa GALAS Algorithm
Estimation of ionization constants using this algorithm is a multi-step procedure involving estimation of pKa microconstants for all possible ionization centers in a hypothetical state of an uncharged molecule ("fundamental microconstants"), numerous corrections of these initial pKa values according to the surrounding of the reaction center and calculation of charge influences of ionized groups to the neighbouring ionization centers. Calculation routine utilizes a database of 4,600 ionization centers, a set of ca. 500 various interaction constants and four interaction calculation methods for different types of interactions, producing a full range of microconstants from which pKa macroconstants are obtained. This allows for a simulation of complete distribution plot of all protonation states of the molecule at different pH conditions. For example, the complete simulated ionization profile for cysteine molecule is illustrated in the following figure:
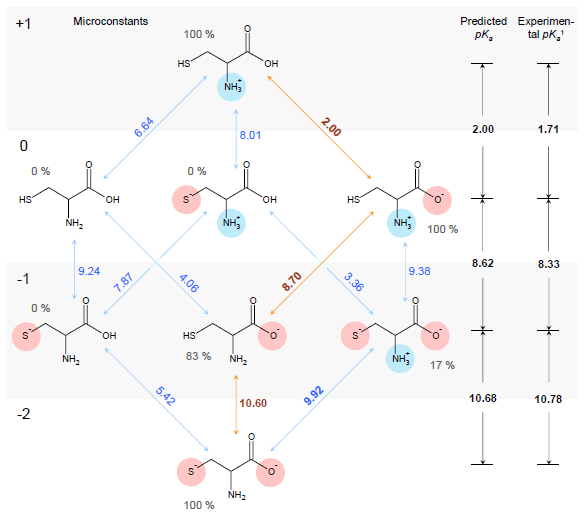
1Experimental pKa values obtained from The Merck Index (see full citation below).
ACD/pKa GALAS algorithm is based on a training set containing 17,593 compounds (>20,000 ionization centers) obtained from various articles in peer-reviewed scientific journals and well-known reference books:
- The Merck Index. An Encyclopedia of Chemicals, Drugs, and Biologicals, O'Neil, M.J., Smith, A., Heckelman, P.E., Budavari, S., Eds. 13th Edition, Merck & Co., Inc., Whitehouse Station, NJ, 2001
- Therapeutic Drugs, Dolery, C., Ed. 2nd Edition, Churchill Livingstone, New York, NY, 1999
- Clarke's Isolation and Identification of Drugs, Moffat, A.C., Jackson, J.V., Moss, M.S., Widdop, B., Eds. 2nd Edition, The Pharmaceutical Press, London, 1986
A specific features of this algorithm include is the graphical/tabular representation of the obtained predictions in the form of pH dependency of:
- Net molecular charge
- Distribution of protonation states
- Average charge of each ionization centre
Description of ACD/pKa Classic Algorithm
This algorithm uses Hammett-type equations and electronic substituent constants (σ) to predict pKa values for ionizable groups. Effects considered by the software include tautomeric equilibria, covalent hydration, and resonance effects in α, β-unsaturated systems.
Hammett-Type Equations — every ionizable group is characterized by several Hammett-type equations that have been parameterized to cover the most popular ionizable functional groups.
Sigma constants — the internal training set contains >3,000 derived experimental electronic constants. When the required substituent constant is not available from the experimental database, one of four algorithms are used to describe electronic effect transmissions through the molecular system.
This method of pKa calculation mimics the experimental situation by "adding" protons to the molecule in the order the molecule would normally be protonated in solution. For example, performing the calculation for a neutral glycine molecule H2N–CH2–COOH will give two values: 9.64 and 2.43. These values are calculated for the actual ionization equilibria:
H3N+–CH2–COOH → H2N–CH2–COO- + H+ (pKa = 9.64)
H3N+–CH2–COOH → H3N+–CH2–COO- + H+ (pKa = 2.43)
The internal training set of ACD/pKa Classic algorithm contains 15,932 molecules representing >30,000 pKa values.
Specific features of this particular algorithm are as follows:
- A detailed calculation protocol on how the prediction has been carried out is provided for each molecule (including Hammett-type equations, substituent constants, and literature references where available).
- To improve prediction accuracy and make the model relevant to in-house chemical space or a particular project, the ACD/pKa Classic prediction model offers the ability for training with user provided experimental data. Training is user-friendly, and may be switched on, off, or certain training sets used for different predictions, putting full control in your hands.
Further sections of this document provide more detailed information regarding the various aspects of ACD/pKa Classic algorithm.
Database of Hammett-type Equations
The Hammett-type equations used in ACD/pKa calculations have been parameterized to cover over 1,500 combinations of over 650 of the most popular ionizable functional groups. Each functional group has been characterized by several equations involving different types of substituent constants in order to achieve the most accurate calculation. All equations for a given functional group have been ranked according to their reliability (number of correlated structures, correlation coefficient and standard deviation) and reliability of available substituent constants. For example, the following ranking has been used for calculating pKa values of para-substituted quinolines:
- pKa = 5.009 – 5.058*σI – 4.363*σR+ : n = 10, r = 0.9989, sd = 0.13
- pKa = 4.874 – 4.561*σI – 5.63*σR : n = 10, r = 0.9878, sd = 0.46
- pKa = 5.179 – 5.318*σPara : n = 9, r = 0.9878, sd = 0.42
Database of Electronic Substituent Constants (σ)
There are many variants of the original electronic substituent constant, σ. The ACD/pKa database contains constants for over 1,200 substituents with over 3,000 carefully derived experimental electronic constants. The following table summarizes the number of constant values present in the database.
| Sigma | Number in Database |
|---|---|
| σI | 592 |
| σ* (Taft) | 265 |
| σR | 453 |
| σR– | 157 |
| σR+ | 143 |
| σPara | 585 |
| σMeta | 431 |
| σPara– | 142 |
| σPara+ | 135 |
| σPhosph (P-Acids) | 68 |
| σOrtho (Benzoic acid) | 41 |
| σOrtho (Phenol) | 37 |
| σOrtho (Aniline) | 30 |
| σOrtho (Pyridine) | 48 |
Estimation of Electronic Substituent Constants
Although the parameter database contains a wide array of σ values, in some cases no reliable constant is available. When the required substituent constant is not available from the experimental database it can be calculated by one of the algorithms described in this section.
Electronic Effect Transmission through Skeleton
This estimation is based on the following formula:
σR–G– = σ–G– + ΣzI,R,…–G–∙σI,R,…R– + ΣzI,R,…–G–∙(σIR–∙σRR–)…,
where all σI,R,…R– are substituent R electronic constants (inductive, resonance, etc.) and all zI,R,…sup>–G– are skeleton G transmission constants. The accuracy of the σR–G– calculation is usually better than ±0.05–0.1. The algorithm contains 42 of the most frequently used skeletons G described by 126 such equations:
σI–36, σR–25, σR-–6, σR+–4, σPara–24, σMeta–24, σPhosph–7
For example, the following constants which are calculated for carbamate species containing the carbamate functional group were determined to be σI = 0.45, σR = -0.34, σR- = -0.36, σR+ = -0.38, σPara = 0.10, σMeta = 0.32, σPhosph = 0.0238.

Using these parameters, the pKa of 2-ammonio-4-thioxohexanedioate calculated by this method is 7.72 (experimental is 7.90).

Secondary Algorithm
If the preceding estimate cannot be made, a back-up method is available, based on the following formula:
σR–G– = σ–G– + zI–G–∙σIR–
The accuracy of the σR–G– calculation is usually ±0.15–0.20. It is not as good as the first algorithm, but it can be used to calculate the σI, σ*, σR and σR- electronic constants for any possible substituents.
For example, the constants σI = 0.37, and σR = 0.08 are calculated for N-trifluoromethyl-carbamothioic halides:

Transmission through Aliphatic Cycles
This algorithm is based on the modified Exner-Fiedler method. The original Exner-Fiedler method can be used to calculate electronic transmission effects for only very limited number of aliphatic cycles. The improved ACD/pKa method allows calculation of these effects for any possible aliphatic (poly)cycles.
For example, the calculated transmission factor for variants of bicyclo[1.1.0]butane-1-carboxylic acid is 1.72 (experimental is 1.92).

Transmission through Condensed Polyaromatic Systems
This algorithm is based on the modified Dewar-Grisdale method. The original Dewar-Grisdale method can be used to calculate electronic transmission effects for only very limited number of condensed polyaromatic systems (Dewar M.J.S., Grisdale P.J., J. Am. Chem. Soc., 1962, 84, 3539). [1] The improved ACD/pKa method allows you to calculate these effects for virtually any polyaromatic system.
For example, the pKa of the 3-amino-5-hydroxynaphthalene-2,7-disulfonate calculated by this method is 8.64 (the experimentally determined value is 8.54):

Calculation of Steric Effects
In most cases, steric effects have been taken into account by defining the ionization center as an ionizable functional group with a sufficiently large invariable skeleton. In cases where the variable substituents are in close proximity to ionizable groups, steric effects are calculated by the modified branching equations. For example, pKa of N-monoalkylanilynium ions are calculated by the following equation:
pKa = 4.85 + 0.27 x (nβ)1.84 - 0.08 x (nγ)2.36 + 0.01 x (nδ)2.36 (sd = 0.2)
where nβ, nγ and nδ denote the numbers of atoms in second, third and fourth spheres of the N-alkyl substituent. The accuracy of the pKa calculation for N-t-butyl anilynium is ±0.1, whereas without this equation it would be ±2!
Calculation of Charge Effects
In most cases, charge effects have been taken into account by including the constant charged substituent into the definition of ionizable center. For example, the pKa of carboxy groups in α-amino acids are calculated from the equation characterizing the –CH(NH3+)COOH ionization center. In the cases when the charged substituent is variable, its effect is calculated from the distance to ionization center.
Other Effects
ACD/pKa warns you when other effects may appear which affect the experimentally observed pKa values. These effects, if not properly taken into account, may cause a large discrepancy between the calculated and experimentally observed pKa values.
Tautomeric Equilibria
For certain compounds, there is mixture of two or more structurally distinct species which are in rapid equilibrium. Normally proton transfer is involved in tautomeric equilibria. Some of the most common instances of tautomerism are related to the following forms:
- keto-enol;
- phenol-keto;
- nitroso-oxime;
- aliphatic nitro compounds; and
- imine-enamine.
If you are calculating pKa values for species which contain these functional groups, after entering the compound structure in ACD/Percepta you should always choose the appropriate tautomer from the Select Tautomeric Form dialog box that is automatically shown in such cases. For example, 3 tautomeric forms are possible for the hydroxytriazoliumonate species:

Covalent Hydration
If the energy barrier to the addition of water across a double bond is relatively low, this can be a significant complicating factor in the accurate experimental determination of pKa; thus, ACD/pKa is designed to flag known cases. For example, for pteridine, a pKa calculation will automatically flag the species on the left as undergoing covalent hydration:

Vinylology
Another complicating factor in the calculation and measurement of pKa is vinylology. Vinylology occurs due to resonance effects being transmitted through the double bond. In α,β-unsaturated ketones, nitriles, and esters, such as in the following structures

the γ-hydrogen acquires a level of acidity normally held by the position α to the carbonyl group. Due to vinylology, alkylation at the α-position competes with alkylation at the γ-position.
ACD/pKa does not explicitly flag cases of vinylology, although a message about tautomeric forms may appear.
Limitations
ACD/pKa Classic algorithm will refuse to predict the pKa for structures that:
- Contain more than 255 atoms (note that the program refuses to predict pKa for some cyclic compounds having less than 255 atoms due to the fact that the program uses a cycle-breaking algorithm that increases the number of atoms)
- Do not contain an ionization center
- Contain atoms of non-typical valence
- Contain atoms other than C, H, O, S, P, N, F, Cl, Br, I, Se, Si, Ge, Pb, Sn, As, and B
- Contain two or more fragments
- Contain more than 30 ionizable centers
- Contain d-block or f-block metal atoms
- Contain textual abbreviations which cannot be transformed to structural fragments.
Note: There certainly exist some structures that formally meet the aforementioned limitations, but cannot be calculated with the current algorithm.