Vd: Difference between revisions
Added Vd description and link to poster |
|||
| (5 intermediate revisions by 2 users not shown) | |||
| Line 1: | Line 1: | ||
==Overview== | ===Overview=== | ||
< | |||
This module provides mechanistic predictions of the apprent volume of distribution at steady-state in humans. The predictive model is based on Oie-Tozer pharmacokinetic equation that accounts for the extent of drug binding in both plasma and tissues. Calculations therefore use octanol/water logP (the major determinant of tissue binding) and unbound fraction in plasma (''f''<sub>u, plasma</sub>) as customizable input parameters. | |||
===Module Interface=== | |||
[[Image:Distribution_Vd.png|center]] | |||
<ol> | |||
<li> logP and fraction unbound in plasma (''f''<sub>u, plasma</sub>) are calculated automatically. Alter these values to simulate the limiting effect of the compound's lipophilicity and/or plasma protein binding on its tissue disposition. [[Image:Distribution_Vd_Simulation.png|right]] | |||
:a. Click the "Undo" button to restore the automatically calculated property value (''f''<sub>u, plasma</sub> in the current example) for a compound and recalculate Vd using default parameter values | |||
< | |||
:b. Click to recalculate Vd using the currently specified parameter values | |||
</li> | |||
<li> Calculated apparent volume of distribution of a compound:<br>[[File:Distribution_vd_scale.png|300px]]</li> | |||
<li> Up to 5 most similar structures from the training set with experimental Vd values and references</li> | |||
< | </ol> | ||
<div class="mw-collapsible | <div class="mw-collapsible"> | ||
==Technical information== | ==Technical information== | ||
| Line 34: | Line 33: | ||
* %PPB values represent the overall fraction of drug bound in human plasma, i.e. accounts for interactions with different proteins: albumin, alpha<sub>1</sub>-acid glycoprotein, lipoproteins, SHBG, transcortin etc. ''In vitro'' measurements of the extent of plasma protein binding usually involve equilibrium dialysis, ultrafiltration or ultracentrifugation methods. | * %PPB values represent the overall fraction of drug bound in human plasma, i.e. accounts for interactions with different proteins: albumin, alpha<sub>1</sub>-acid glycoprotein, lipoproteins, SHBG, transcortin etc. ''In vitro'' measurements of the extent of plasma protein binding usually involve equilibrium dialysis, ultrafiltration or ultracentrifugation methods. | ||
%PPB = (1 – ''f<sub>u</sub>'') * 100% where ''f<sub>u</sub>'' is fraction of free (unbound) drug in plasma ranging from 0 to 1. | %PPB = (1 – ''f<sub>u</sub>'') * 100% where ''f<sub>u</sub>'' is fraction of free (unbound) drug in plasma ranging from 0 to 1. | ||
* | * Distribution\Vd module calculates apparent Volume of Distribution of drugs in human body expressed in liters per kg body weight (L/kg). | ||
===Experimental data=== | ===Experimental data=== | ||
Experimental data that were utilized to build predictive models were collected from drug prescription information, reference pharmacokinetic tabulations and many original articles. The main sources of Vd data were well-known pharmacokinetic books: "Therapeutic Drugs" (ed. by C. dollery), and Goodman & Gilman's "The Pharmacological Basis of Therapeutics", while albumin affinity constants were collected mainly from original articles by Valko K. et al. ''J Pharm Sci.'' '''2003''';92(11):2236-48. [ | Experimental data that were utilized to build predictive models were collected from drug prescription information, reference pharmacokinetic tabulations and many original articles. The main sources of Vd data were well-known pharmacokinetic books: "Therapeutic Drugs" (ed. by C. dollery), and Goodman & Gilman's "The Pharmacological Basis of Therapeutics", while albumin affinity constants were collected mainly from original articles by Valko K. et al. ''J Pharm Sci.'' '''2003''';92(11):2236-48. [https://pubmed.ncbi.nlm.nih.gov/14603509], and Kratochwil N.A. et al. ''Biochem Pharmacol.'' '''2002''';64(9):1355-74. [https://pubmed.ncbi.nlm.nih.gov/12392818] | ||
The compiled data sets contain %PPB data for almost 1500 compounds, about 340 albumin affinity constants and almost 800 Vd values. | The compiled data sets contain %PPB data for almost 1500 compounds, about 340 albumin affinity constants and almost 800 Vd values. | ||
===Model development (technical details)=== | ===Model development (technical details)=== | ||
Both %PPB and log ''K<sub>a</sub><sup>HSA</sup>'' | The predictive models of %PPB and log ''K<sub>a</sub><sup>HSA</sup>'' were derived using GALAS (Global, Adjusted Locally According to Similarity) modeling methodology (please refer to [http://www.ncbi.nlm.nih.gov/pubmed/20373217] for more details). | ||
Each GALAS model consists of two parts: | |||
* Global (baseline) statistical model that reflects general trends in the variation of the property of interest. | |||
* Similarity-based routine that performs local correction of baseline predictions taking into account the differences between baseline and experimental values for the most similar training set compounds. | |||
<br> | |||
GALAS methodology also provides the basis for estimating reliability of predictions by the means of calculated Reliability Index (''RI'') value that takes into account: | |||
* Similarity of tested compound to the training set molecules. | |||
* Consistence of experimental values and baseline model prediction for the most similar similar compounds from the training set. | |||
Reliability Index ranges from 0 to 1 (0 corresponds to a completely unreliable, and 1 - a highly reliable prediction) and serves as an indication whether a submitted compound falls within the Model Applicability Domain. Compounds obtaining predictions ''RI'' < 0.3 are considered outside of the Applicability Domain of the model. | |||
Both %PPB and log ''K<sub>a</sub><sup>HSA</sup>'' are '''Trainable''' meaning that their Applicability Domains may be easily extended by addition of ‘in-house’ experimental data to the module Self-training Library. Notably, the baseline statistical model does not need to be rebuilt from scratch to account for data entered by the user. The model is retrained automatically as new compounds are added to the Library. Model trainability would be particularly useful for predicting serum albumin affinity constants as literature data sets are very sparse, thus the ability to take advantage of large ‘in-house’ libraries gives the potential for a significant improvement of both accuracy and reliability of calculations. | |||
Volume of Distribution uses a mechanistic model based on physiological Øie-Tozer equation that relates Vd to the fraction unbound in plasma (calculated using %PPB model described above) and fraction unbound in tissues (calculated by a non-linear ionization-specific model in terms of LogP and pKa). For more technical details about %PPB and Vd models please refer to [http://perceptahelp.acdlabs.com/docs/Distribution.pdf]. | |||
</div> | </div> | ||
</div> | </div> | ||
Latest revision as of 08:40, 20 October 2022
Overview
This module provides mechanistic predictions of the apprent volume of distribution at steady-state in humans. The predictive model is based on Oie-Tozer pharmacokinetic equation that accounts for the extent of drug binding in both plasma and tissues. Calculations therefore use octanol/water logP (the major determinant of tissue binding) and unbound fraction in plasma (fu, plasma) as customizable input parameters.
Module Interface

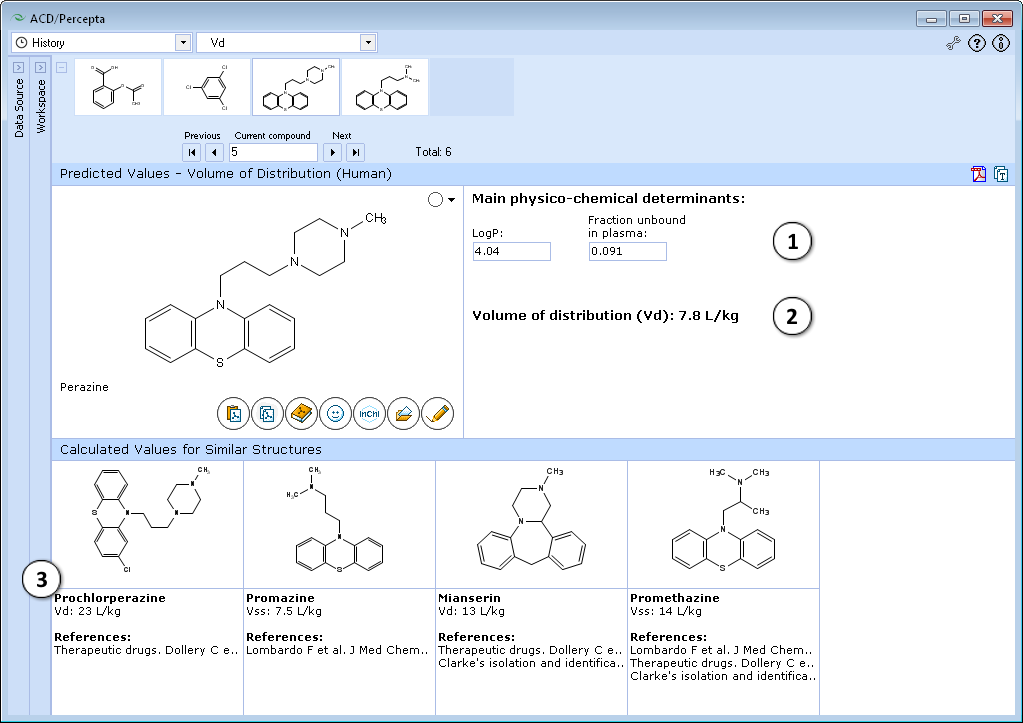
- logP and fraction unbound in plasma (fu, plasma) are calculated automatically. Alter these values to simulate the limiting effect of the compound's lipophilicity and/or plasma protein binding on its tissue disposition.

- a. Click the "Undo" button to restore the automatically calculated property value (fu, plasma in the current example) for a compound and recalculate Vd using default parameter values
- b. Click to recalculate Vd using the currently specified parameter values
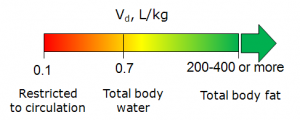
- Calculated apparent volume of distribution of a compound:

- Up to 5 most similar structures from the training set with experimental Vd values and references
Technical information
Calculated quantitative parameters
Parameters calculated by Distribution\Protein Binding module include percentage plasma protein binding values (%PPB) and log KaHSA constants. These properties are related, but characterize provide slightly different information about the considered process.
- log KaHSA represents the drug’s affinity constant to human serum albumin – the major carrier protein in plasma. Experimental data come from direct chromatographic determination of binding strength to that particular protein.
log KaHSA = log ([LA]/([L][A])) where [LA] is concentration of ligand bound to albumin, [L] – that of free ligand, and [A] – concentration of free albumin which is estimated at ~0.6 mM in human plasma.
- %PPB values represent the overall fraction of drug bound in human plasma, i.e. accounts for interactions with different proteins: albumin, alpha1-acid glycoprotein, lipoproteins, SHBG, transcortin etc. In vitro measurements of the extent of plasma protein binding usually involve equilibrium dialysis, ultrafiltration or ultracentrifugation methods.
%PPB = (1 – fu) * 100% where fu is fraction of free (unbound) drug in plasma ranging from 0 to 1.
- Distribution\Vd module calculates apparent Volume of Distribution of drugs in human body expressed in liters per kg body weight (L/kg).
Experimental data
Experimental data that were utilized to build predictive models were collected from drug prescription information, reference pharmacokinetic tabulations and many original articles. The main sources of Vd data were well-known pharmacokinetic books: "Therapeutic Drugs" (ed. by C. dollery), and Goodman & Gilman's "The Pharmacological Basis of Therapeutics", while albumin affinity constants were collected mainly from original articles by Valko K. et al. J Pharm Sci. 2003;92(11):2236-48. [1], and Kratochwil N.A. et al. Biochem Pharmacol. 2002;64(9):1355-74. [2] The compiled data sets contain %PPB data for almost 1500 compounds, about 340 albumin affinity constants and almost 800 Vd values.
Model development (technical details)
The predictive models of %PPB and log KaHSA were derived using GALAS (Global, Adjusted Locally According to Similarity) modeling methodology (please refer to [3] for more details).
Each GALAS model consists of two parts:
- Global (baseline) statistical model that reflects general trends in the variation of the property of interest.
- Similarity-based routine that performs local correction of baseline predictions taking into account the differences between baseline and experimental values for the most similar training set compounds.
GALAS methodology also provides the basis for estimating reliability of predictions by the means of calculated Reliability Index (RI) value that takes into account:
- Similarity of tested compound to the training set molecules.
- Consistence of experimental values and baseline model prediction for the most similar similar compounds from the training set.
Reliability Index ranges from 0 to 1 (0 corresponds to a completely unreliable, and 1 - a highly reliable prediction) and serves as an indication whether a submitted compound falls within the Model Applicability Domain. Compounds obtaining predictions RI < 0.3 are considered outside of the Applicability Domain of the model.
Both %PPB and log KaHSA are Trainable meaning that their Applicability Domains may be easily extended by addition of ‘in-house’ experimental data to the module Self-training Library. Notably, the baseline statistical model does not need to be rebuilt from scratch to account for data entered by the user. The model is retrained automatically as new compounds are added to the Library. Model trainability would be particularly useful for predicting serum albumin affinity constants as literature data sets are very sparse, thus the ability to take advantage of large ‘in-house’ libraries gives the potential for a significant improvement of both accuracy and reliability of calculations.
Volume of Distribution uses a mechanistic model based on physiological Øie-Tozer equation that relates Vd to the fraction unbound in plasma (calculated using %PPB model described above) and fraction unbound in tissues (calculated by a non-linear ionization-specific model in terms of LogP and pKa). For more technical details about %PPB and Vd models please refer to [4].