PK Explorer: Difference between revisions
No edit summary |
mNo edit summary |
||
| (One intermediate revision by the same user not shown) | |||
| Line 44: | Line 44: | ||
</ul> | </ul> | ||
</li> | </li> | ||
<li>Select different types of simulated graphs: | <li><span id="Simulated_graphs">Select different types of simulated graphs:</span> | ||
[[Image:PK_Explorer_Graphs.png|right]] | [[Image:PK_Explorer_Graphs.png|right]] | ||
<ul> | <ul> | ||
| Line 79: | Line 79: | ||
<br> | <br> | ||
<div class="mw-collapsible | <div class="mw-collapsible"> | ||
==Technical information== | ==Technical information== | ||
Latest revision as of 07:40, 20 June 2017
Overview
PK Explorer module is a tool for exploring pharmacokinetic curves using physicochemical parameters of drugs as inputs for calculations. It provides the possibility to explore the dependences of oral bioavailability and drug plasma levels on physico-chemical parameters of compounds and dose. It also simulates drug plasma concentration–time (Cp–t) curve. Differential equations describing solubility in the gastrointestinal tract, passive-absorption, first-pass effect in liver and gut, volume of distribution and total body clearance are considered by PK Explorer.
Features
PK Explorer simulates the following dependencies:
- %F–LogP – dependence of oral bioavailability on LogP at defined dose
- Cp(Max)–LogP – dependence of maximum achievable drug concentration on LogP at defined dose
- %F–Dose – bioavailability–dose relationship.
- Cp(Max)–Dose – shows maximum achievable drug plasma levels at different doses
- Cp–Time – simulation of plasma concentration–time curves. Two curves are simulated corresponding for drug plasma levels after oral and intravenous administration.
- Required parameters characterizing absorption (ka), total body clearance (ke), solubility in gastrointestinal tract (SolGI), volume of distribution (Vd), presystemic metabolism in gut and liver (First-pass) are estimated automatically. However, since in silico predictions of these PK parameters may often lead to significant errors in estimation of drug plasma concentration, any of these parameters can be changed by entering the new value, and PK simulation can be repeated with new parameters
- Predicted values of ka, ke, SolGI may also be recalculated if altered values of main physicochemical determinants (LogP and pKa) are entered.
- Along with graphical simulations, numerical values of relevant pharmacokinetic parameters are calculated, including maximum achievable plasma level and the corresponding time (Cp(max) and Tmax), area under the concentration time curve (AUC) after oral and intravenous administration, as well as oral bioavailability (%F).
Interface

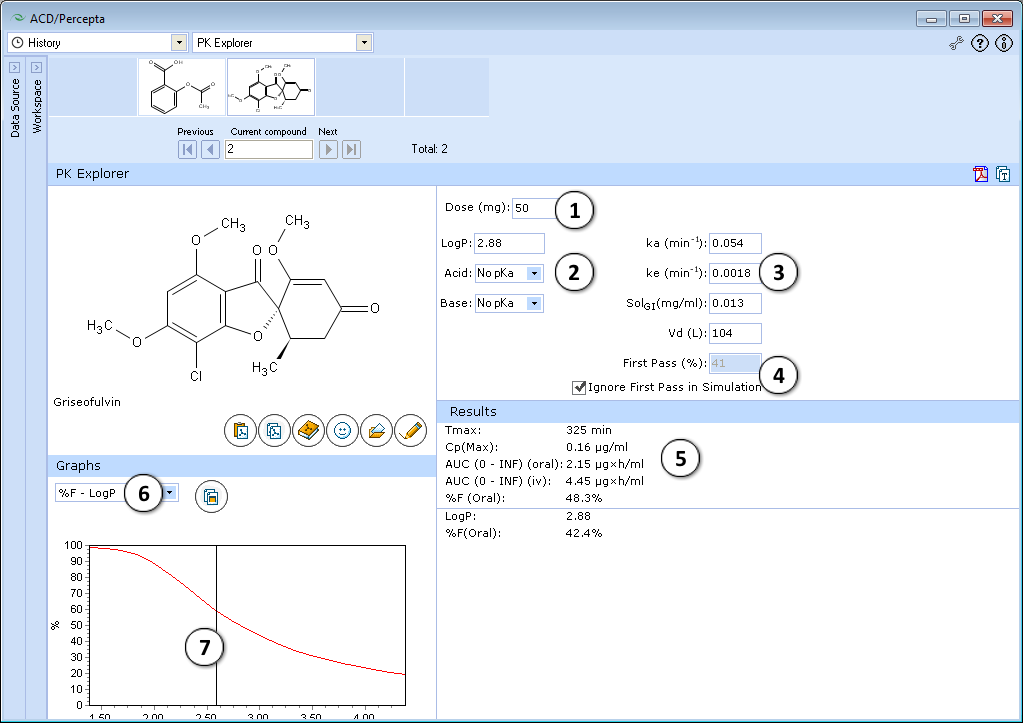
- 50 mg is the default oral drug dose. Enter any dose for PK exploring.
- Hydrophobicity (logP) and ionization (pKa) are the principal descriptors in the predicting of starting (input) pharmacokinetic parameters (ka, ke, Vd, SolGI). These descriptors are calculated in silico (see LogP and pKa for background), but the quality of PK exploring can be significantly improved by entering experimental logP and pKa and repeating calculations.
- Required parameters characterizing absorption (ka), total body clearance (ke), solubility in gastrointestinal tract (SolGI), volume of distribution (Vd), presystemic metabolism in gut and liver (First-pass) are calculated automatically. Any of these parameters can be changed by entering the new value, and PK simulation can be repeated with new parameters.
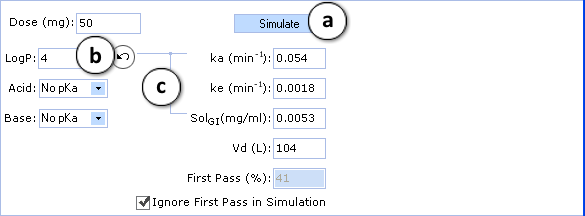
- a. Click to perform a new simulation using the currently specified parameter values.
- b. Click to reverse to an automatically calculated property value (logP in the given figure) for a compound.
- c. Lines indicate which PK input parameters (ka, SolGI) are automatically recalculated according to new logP (or pKa) values.
- The effect of presystemic metabolism on drug plasma levels is ignored by default. Uncheck to activate it and type your value of presystemic metabolism in the box.
- The following simulated parameters are presented:
- tmax – time when drug level in plasma achieves maximum
- Cpmax – drug plasma concentration at this time
- AUC0→∞ (oral) and AUC0→∞ (iv) are area under the plasma concentration–time curve after oral and intravenous administration of drug
- Select different types of simulated graphs:

- %F–LogP – dependence of oral bioavailability on logP at defined dose
- Cp(Max)–LogP – dependence of maximum achievable drug concentration on logP at defined dose
- %F–Dose – bioavailability–dose dependence
- Cp(Max)–Dose – shows maximum achievable drug plasma levels at different doses
- Cp–Time – simulated plasma concentration–time curve
- Graphs are interconnected with the lower table. In the presented example, drag the slider over the range of logP values to see the exact values of %F oral

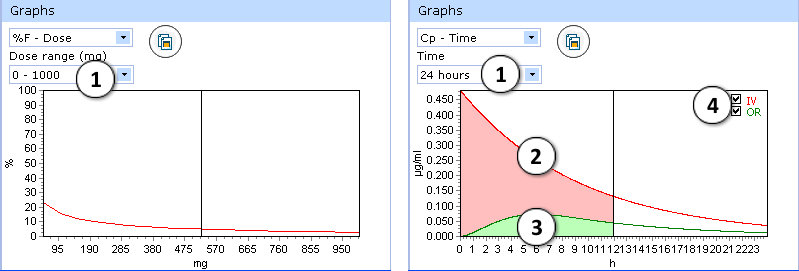
Certain types of graphs have additional visualization options:

- %F-Dose graph:
- select desired dose range to be displayed
- Cp(max)-Dose graph:
- Select the time interval to be displayed.
- Two drug plasma concentration–time curves are presented in the Cp-Time graph.
The red curve shows drug concentration changes with time after intravenous administration. - The green curve indicates changes of drug concentration with time after oral administration.
- Check/uncheck to show/hide the “intravenous” or “oral” curve on the plot.
Technical information
Simulation model
The mathematical model that is used for simulations performed by PK Explorer and Oral Bioavailability modules is based on differential equations describing solubility in the gastrointestinal tract, passive-absorption in jejunum and elimination (total body clearance). Other pharmacokinetic properties such as first-pass effect in liver and gut and volume of distribution are also considered in simulations. Quantitative %F values are calculated as a ratio of AUCs after oral and intravenous administration. Also, the employed simulation model allows evaluating the dose dependence of bioavailability.
Validation
Validation Set & Assessment Procedure
Since the predictions are based on a mechanistic simulation model rather that formal statistical fitting to a set of data points, the validation procedure was not based on a conventional training/test set approach. Instead, a set of clinical fraction absorbed (fa) data together with dosage information for 28 drugs reported by Parrott & Lavé [1] (originating mainly from a compilation by Zhao et al. [2]) was used for validation purposes.
The model performance was assessed in several ways:
- Qualitatively, by evaluating the accuracy of three-class classification, where the compounds were categorized by their calculated extent of absorption in the following manner:
- Low: fa ≤ 33%
- Moderate: 33% < fa < 66%
- High: fa ≥ 66%
- Quantitatively, using the Residual Mean Square Error (RMSE) statistic and visual inspection of the correlation between observed and predicted fa values of the considered drugs.
Validation results
The model performance for validation set compounds is demonstrated in the Table below. Notably, the software did not produce any two-class misclassification errors (when a molecule having low fa is predicted to be well-absorbed or vice versa) except pirenzepine (exp. fa = 27% at 50 mg) which is known as P-glycoprotein substrate [3] and its bioavailability is significantly limited by P-gp efflux.
| Compound name | Dose, mg | Experimental fa (%) | Predicted fa (%) | Experimental class | Predicted class |
|---|---|---|---|---|---|
| Acyclovir | 350 | 23 | 17.9 | Low | Low |
| Amiloride | 10 | 50 | 9.1 | Moderate | Low |
| Antipyrine | 600 | 97 | 99.5 | High | High |
| Atenolol | 50 | 50 | 13.9 | Moderate | Low |
| Carbamazepine | 200 | 70 | 78 | High | High |
| Chloramphenicol | 250 | 90 | 98.9 | High | High |
| Desipramine | 150 | 100 | 99.2 | High | High |
| Diazepam | 5 | 100 | 99 | High | High |
| Diltiazem | 90 | 90 | 99.7 | High | High |
| Etoposide | 350 | 50 | 95.8 | Moderate | High |
| Furosemide | 80 | 61 | 30.6 | Moderate | Low |
| Ganciclovir | 75 | 3 | 8.9 | Low | Low |
| Hydrochlorothiazide | 50 | 69 | 63.1 | High | Moderate |
| Ketoprofen | 75 | 92 | 99.4 | High | High |
| Metoprolol | 100 | 95 | 96.9 | High | High |
| Naproxen | 500 | 99 | 99.5 | High | High |
| Penicillin V | 200 | 38 | 65 | Moderate | Moderate |
| Pirenzepine | 50 | 27 | 94 | Low | High |
| Piroxicam | 20 | 100 | 94.5 | High | High |
| Progesterone | 2.5 | 100 | 93.6 | High | High |
| Propranolol | 240 | 99 | 99.3 | High | High |
| Ranitidine | 60 | 63 | 51.1 | Moderate | Moderate |
| Saquinavir | 600 | 30 | 48.4 | Low | Moderate |
| Sulpiride | 200 | 44 | 41.9 | Moderate | Moderate |
| Terbutaline | 10 | 62 | 19.5 | Moderate | Low |
| Theophylline | 200 | 100 | 99.5 | High | High |
| Verapamil | 120 | 100 | 99.1 | High | High |
| Warfarin | 5 | 98 | 99.1 | High | High |
| Statistics | No. of compounds: 28 | RMSE: 22%* | RMSE: 17%** | Correct: 20/28 (71%)* | Correct: 20/25 (80%)** |
* - P-gp substrates included
** - P-gp substrates excluded
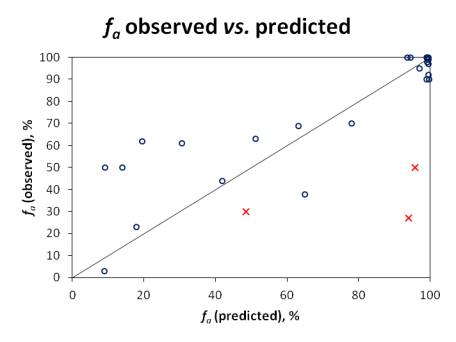
Qualitative evaluation does not reveal the full picture, since compounds with fa values near the class boundaries would often be misclassified, even though the actual prediction would not be far off the experimental value. Therefore, quantitative predictions were also visualized in the scatter plot below:

Since carrier-mediated transport effects can be reliably accounted in the simulation only if experimentally measured permeabilities are used, Pinrenzepine and two other compounds clearly affected by P-gp efflux (Saquinavir and Etoposide) were excluded from quantitative analysis - these are marked by red crosses in the scatter plot and the respective experimental values are highlighted in red in the data table. For the majority of remaining drugs, calculated values are in good agreement with clinical data, except several basic molecules (such as terbutaline, amiloride) underpredicted by more than 30%. However, one cannot disregard the possible contribution of carrier-mediated influx for these small cationic compounds. Once again, the overall RMSE of 17% was obtained with the software operating in 'pure' in silico mode, i.e., the predictions were performed using only the compounds' structure as input. On the other hand, ACD/PK Explorer module provides the potential for further improvement of prediction accuracy by offering full in combo simulation possibilities with a wide range of accepted input parameters including basic physicochemical properties (LogP and pKa), solubility, permeability, elimination rate constant, and volume of distribution.